Illinois Workplace Wellness - Summary of Results
Summary of Results
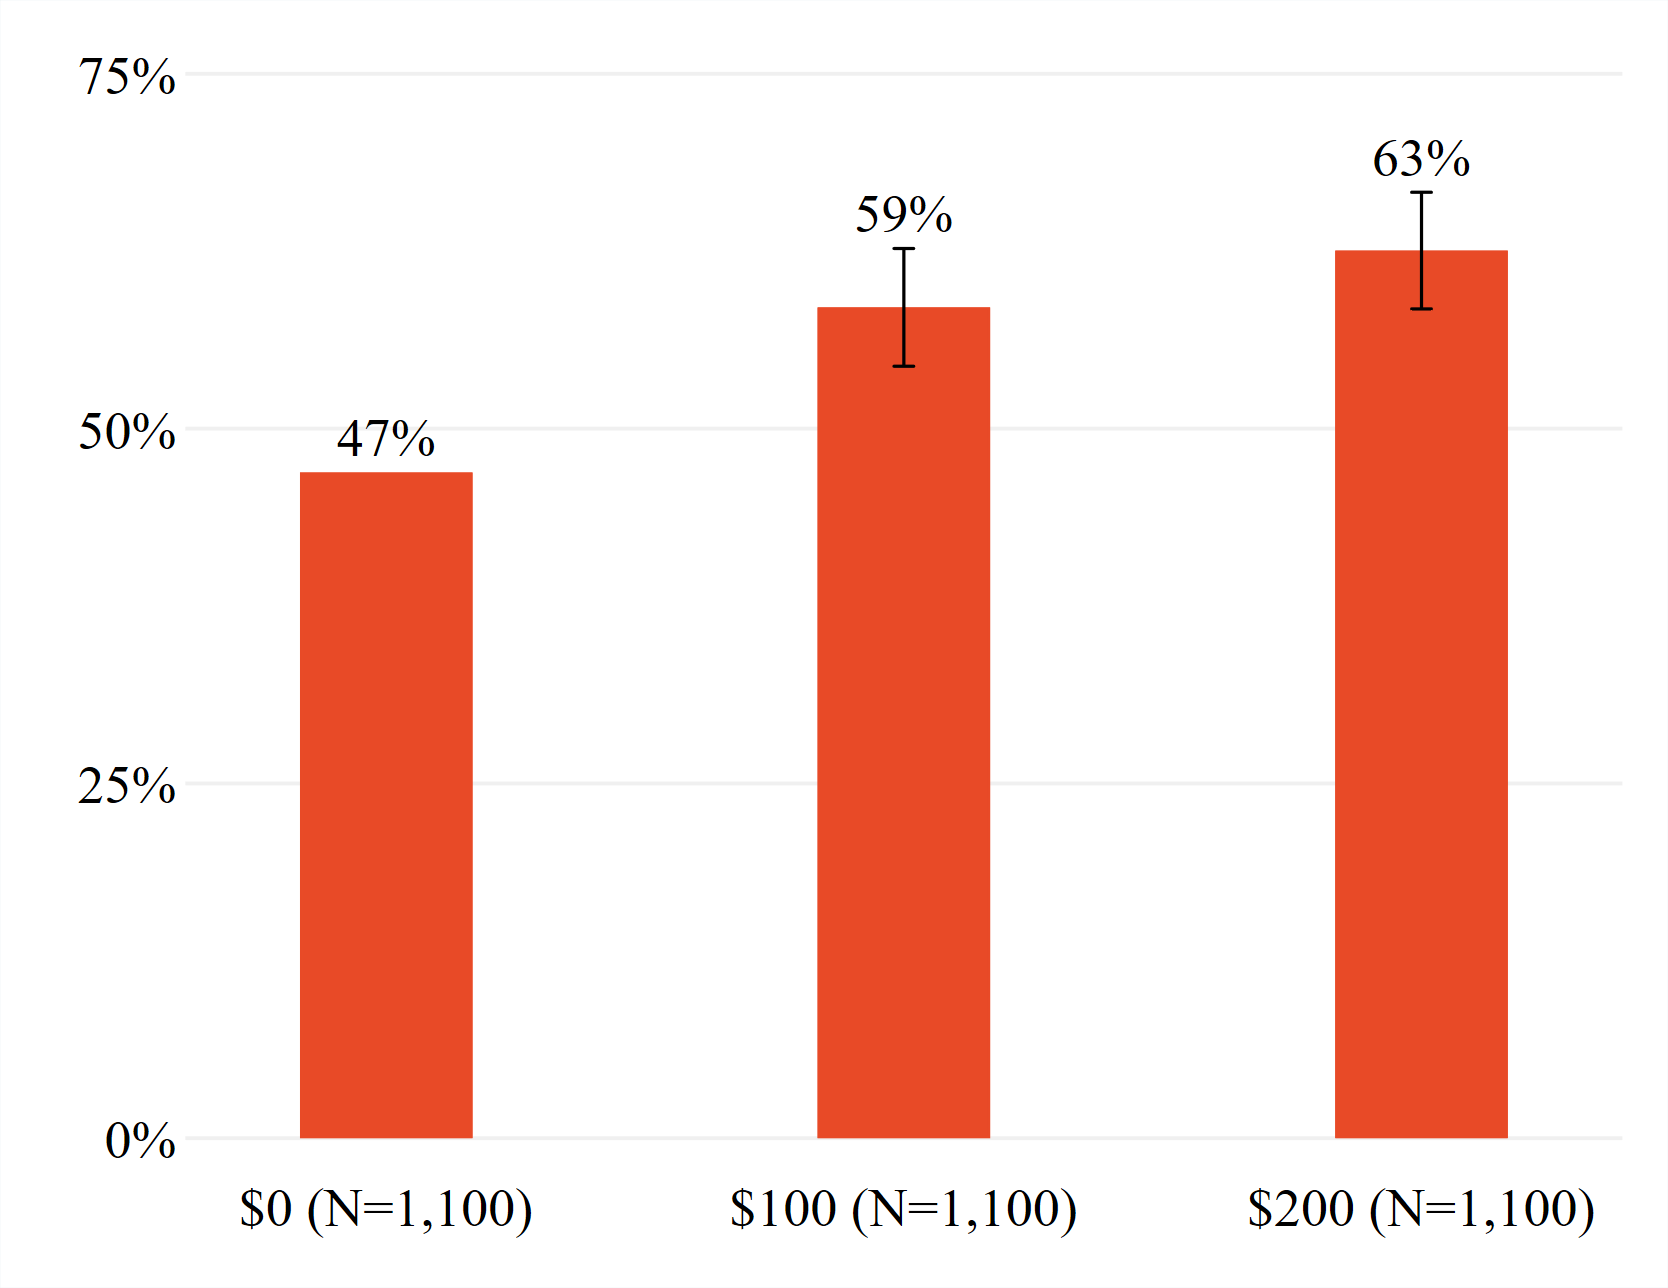
Paying employees to participate in health screenings works, but only to a point
Participation Response to Incentives
Health screening participation, by size of incentive
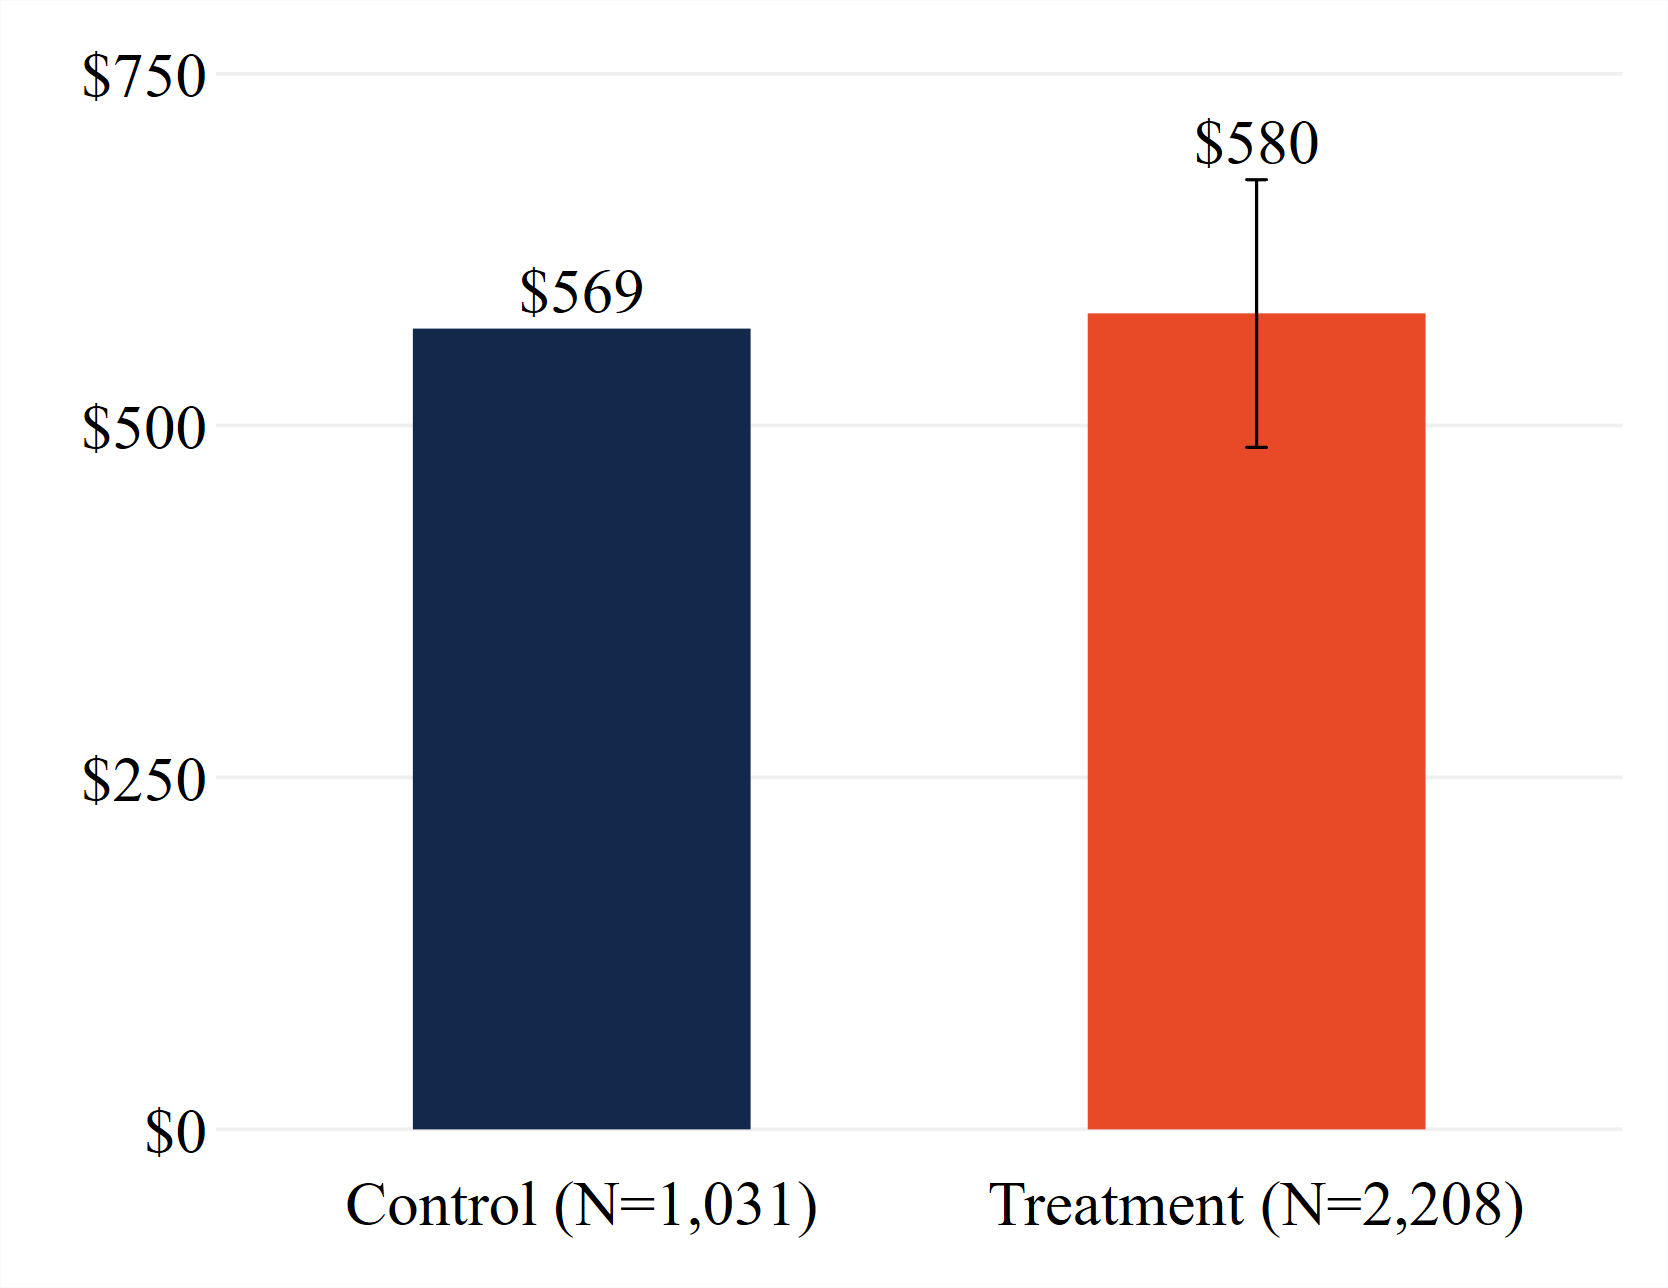
After 1 year, workplace wellness did not change health care costs
Medical Spending Effects
Post-intervention, average monthly medical spending
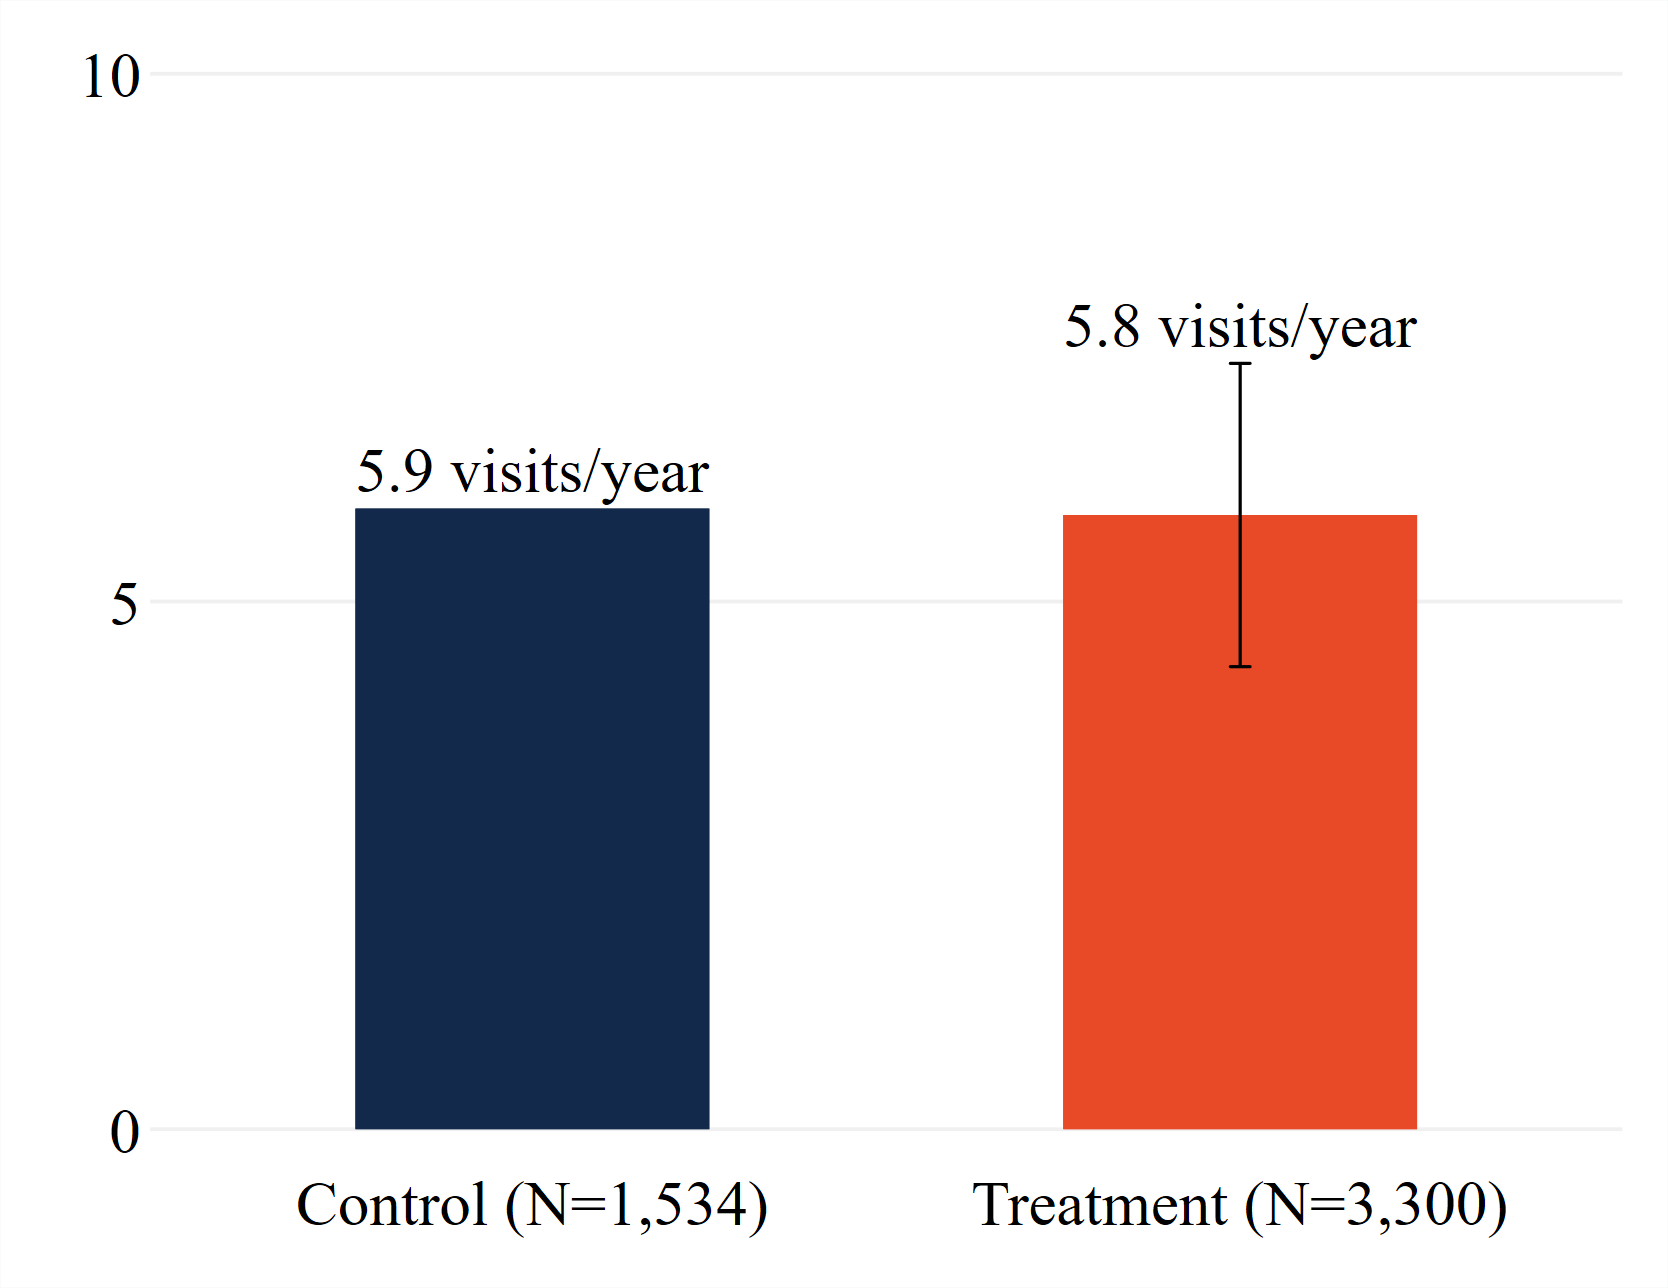
After 1 year, workplace wellness also did not change employees' measured health behaviors
Gym Usage Effects
Post-intervention average annual gym visits
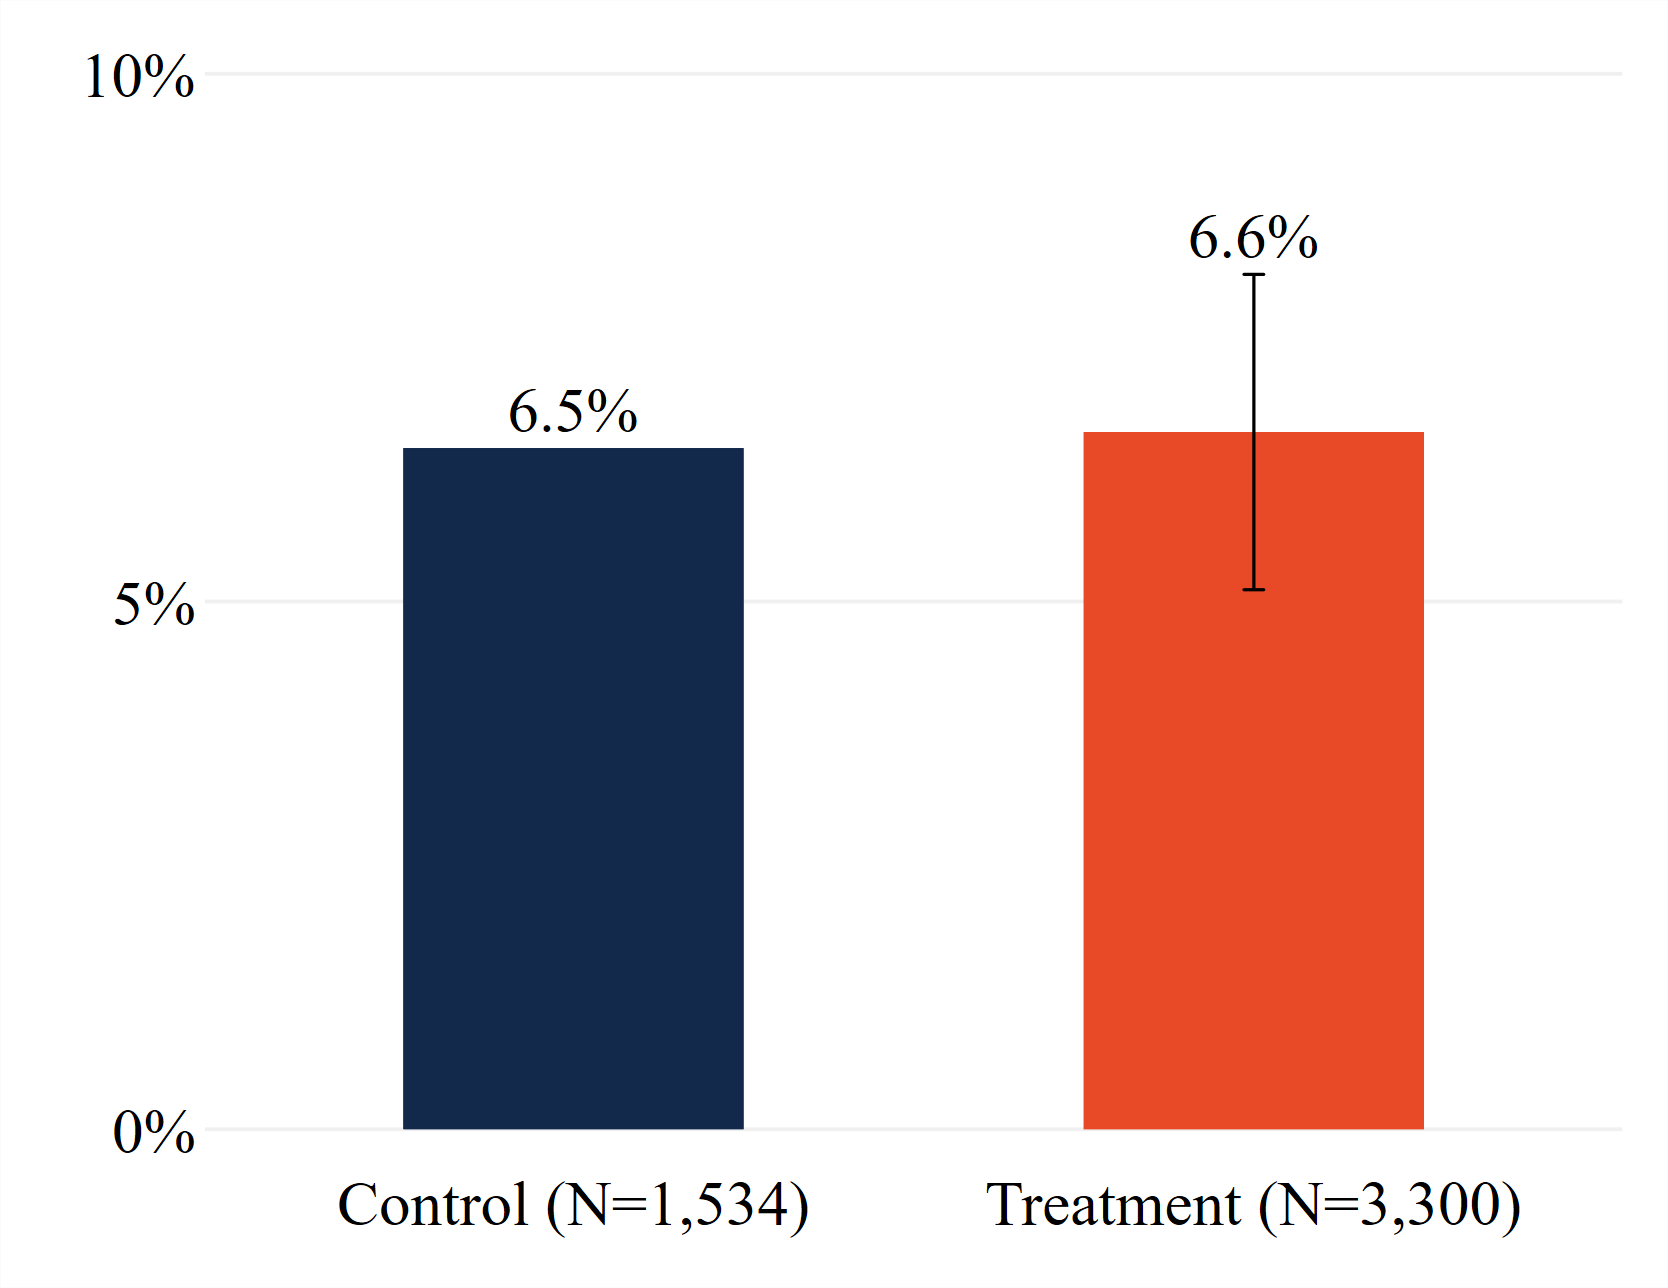
Running Event Effects
Post-intervention running event participation
Employees who chose to participate in workplace wellness already had lower health care costs before the program began
Prior Medical Spending
Pre-intervention average medical spending among treatment group members
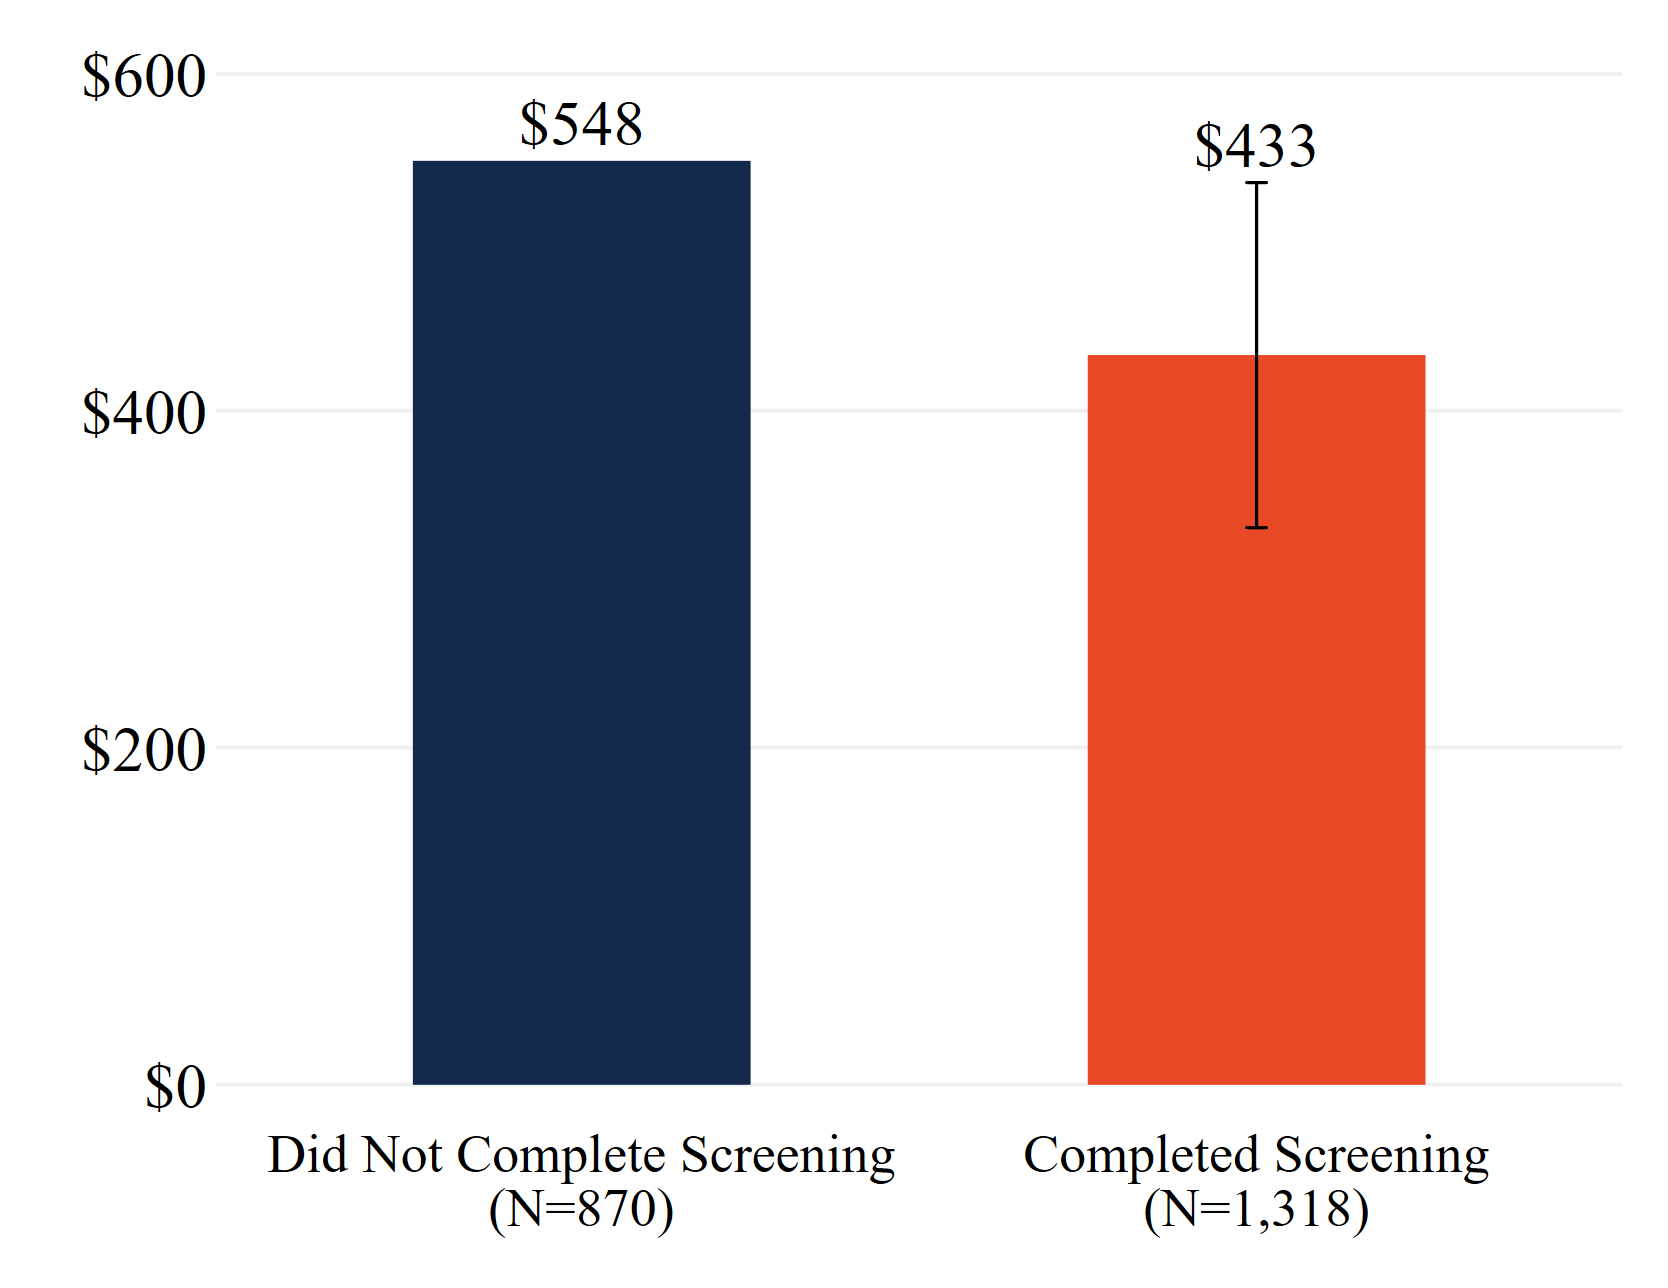
This figure shows average monthly medical spending for subjects in the treatment group who did and did not choose to complete a screening. The data are from the pre-intervention period August 2016 to July 2016, and thus are unaffected by the intervention. The screened and non-screened groups include 870 and 1,318 members, respectively. Vertical bars display 95% confidence intervals on the difference in means relative to the non-screened group.
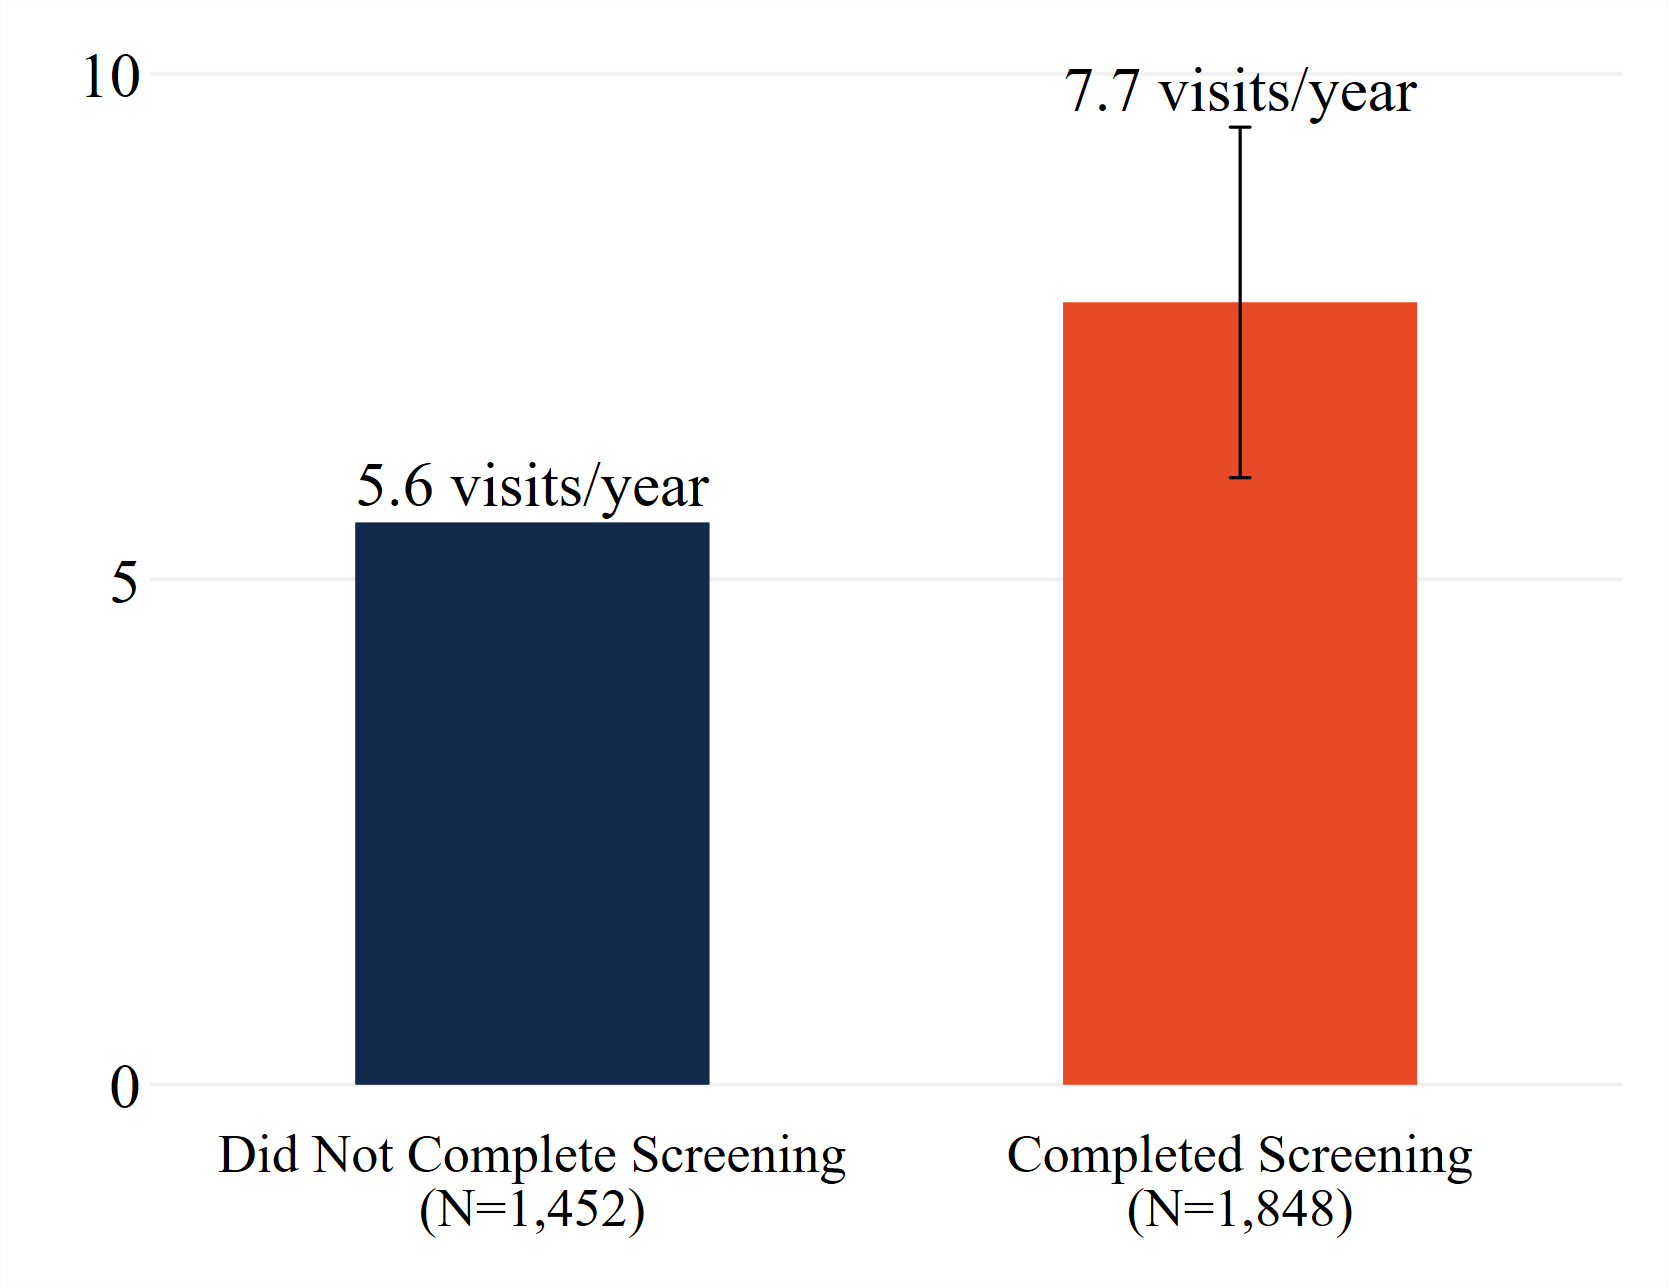
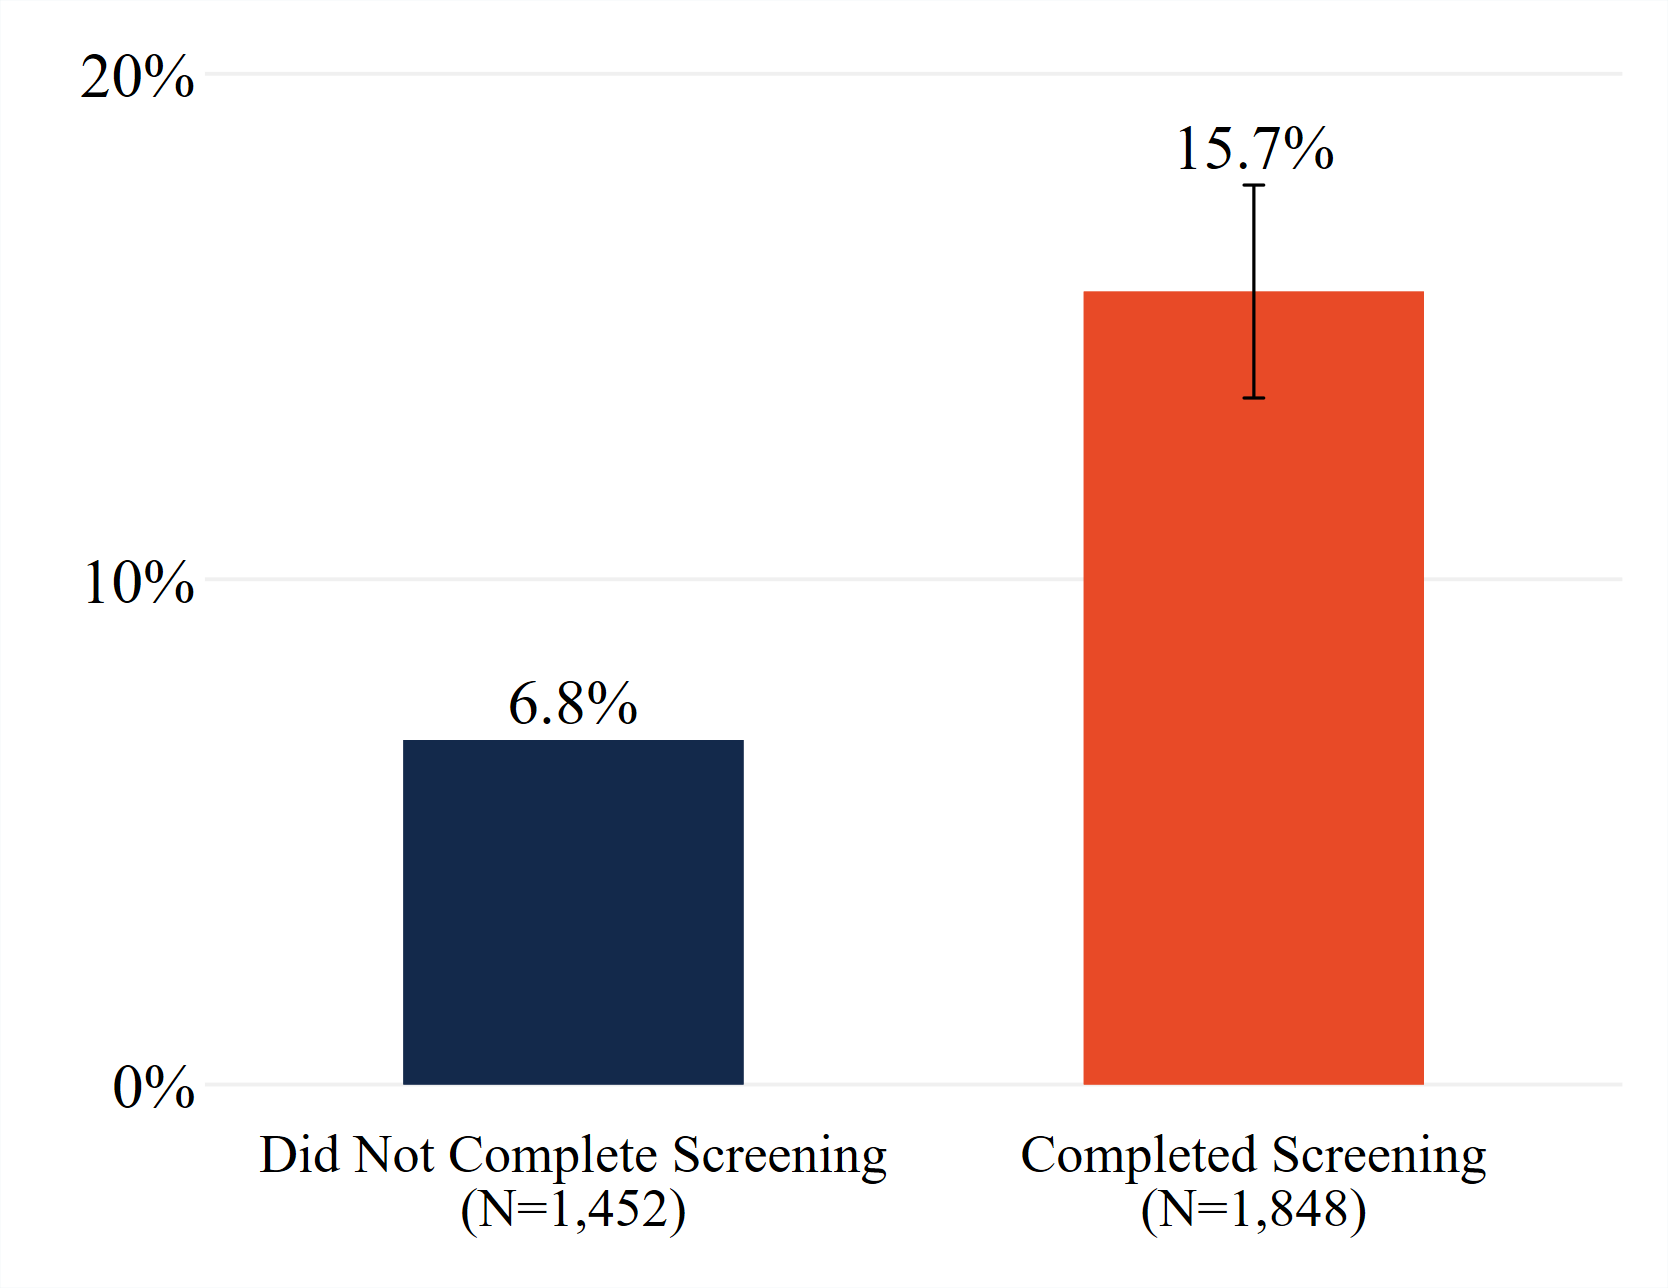
Employees who chose to participate in workplace wellness were already healthier before the program began
Prior Gym Usage
Pre-intervention average annual gym visits among treatment group members
Prior Running Experience
Pre-intervention running event participation among treatment group members
But a lot of questions remain about if and how these programs work.
We are continuing to collect data to evaluate the long-run effects of our intervention. For more details on our first set of results, see the full study.
Visit our downloads page to view our publications and publicly available datasets.