Medicare vs Medicaid: Cost and Health Outcomes
It costs the government more to cover the same beneficiary under Medicare than Medicaid, according to a study of disabled individuals who aged from one program into the other.
In Medicaid vs Medicare: Evidence from Medicaid to Medicare Transitions at 65 (NBER RDRC Paper NB20-15), Timothy Layton, Nicole Maestas, Daniel Prinz, Mark Shepard, and Boris Vabson find that most of the difference stems from higher payment rates to providers rather than from increased use of healthcare.
Providing coverage through Medicare costs the government 13 percent more than through Medicaid, when comparing the same disabled beneficiaries under Medicaid coverage pre-65 versus Medicare post-65. The study finds that provider reimbursement rates are about 10 percent higher on average under Medicare, accounting for three-quarters of the increased cost of coverage. Overall healthcare utilization is roughly comparable across the two programs, only 3 percent higher under Medicare. However, there was a substantial change to the underlying composition of utilization as beneficiaries transitioned to Medicare, with a reduction in acute care and an increase in outpatient and primary care. This shift could be indicative of improved quality outcomes under Medicare, as well as improved primary care access. Improved primary care access under Medicare could, in turn, be the result of higher primary care reimbursement rates.
The federal government, while footing the bill for a large share of Medicaid, gives states wide flexibility in offering benefits and setting fee schedules. Some states, including Montana, North Dakota, and Wyoming, pay fees that are close to those for Medicare. However, most states pay much lower rates than Medicare, including such states as California, New Jersey, and Rhode Island. In their study, the researchers pool data from different state Medicaid programs together to examine how state Medicaid programs—on average—compare to Medicare.
The researchers focus on disabled beneficiaries because they account for 30 to 40 percent of Medicare and Medicaid spending while making up just 15 percent of enrollees. Disabled beneficiaries are also covered by a mix of insurance types, with some covered by Medicaid only, others by Medicare only, and some covered by both at once. Therefore, the question of how these different coverage types compare is particularly applicable and policy relevant for the disabled population. Most disabled Medicaid recipients automatically gain Medicare coverage at 65, with Medicare becoming their primary insurer. This allows the researchers to directly compare health outcomes and costs for the same beneficiaries under the two different insurance programs.
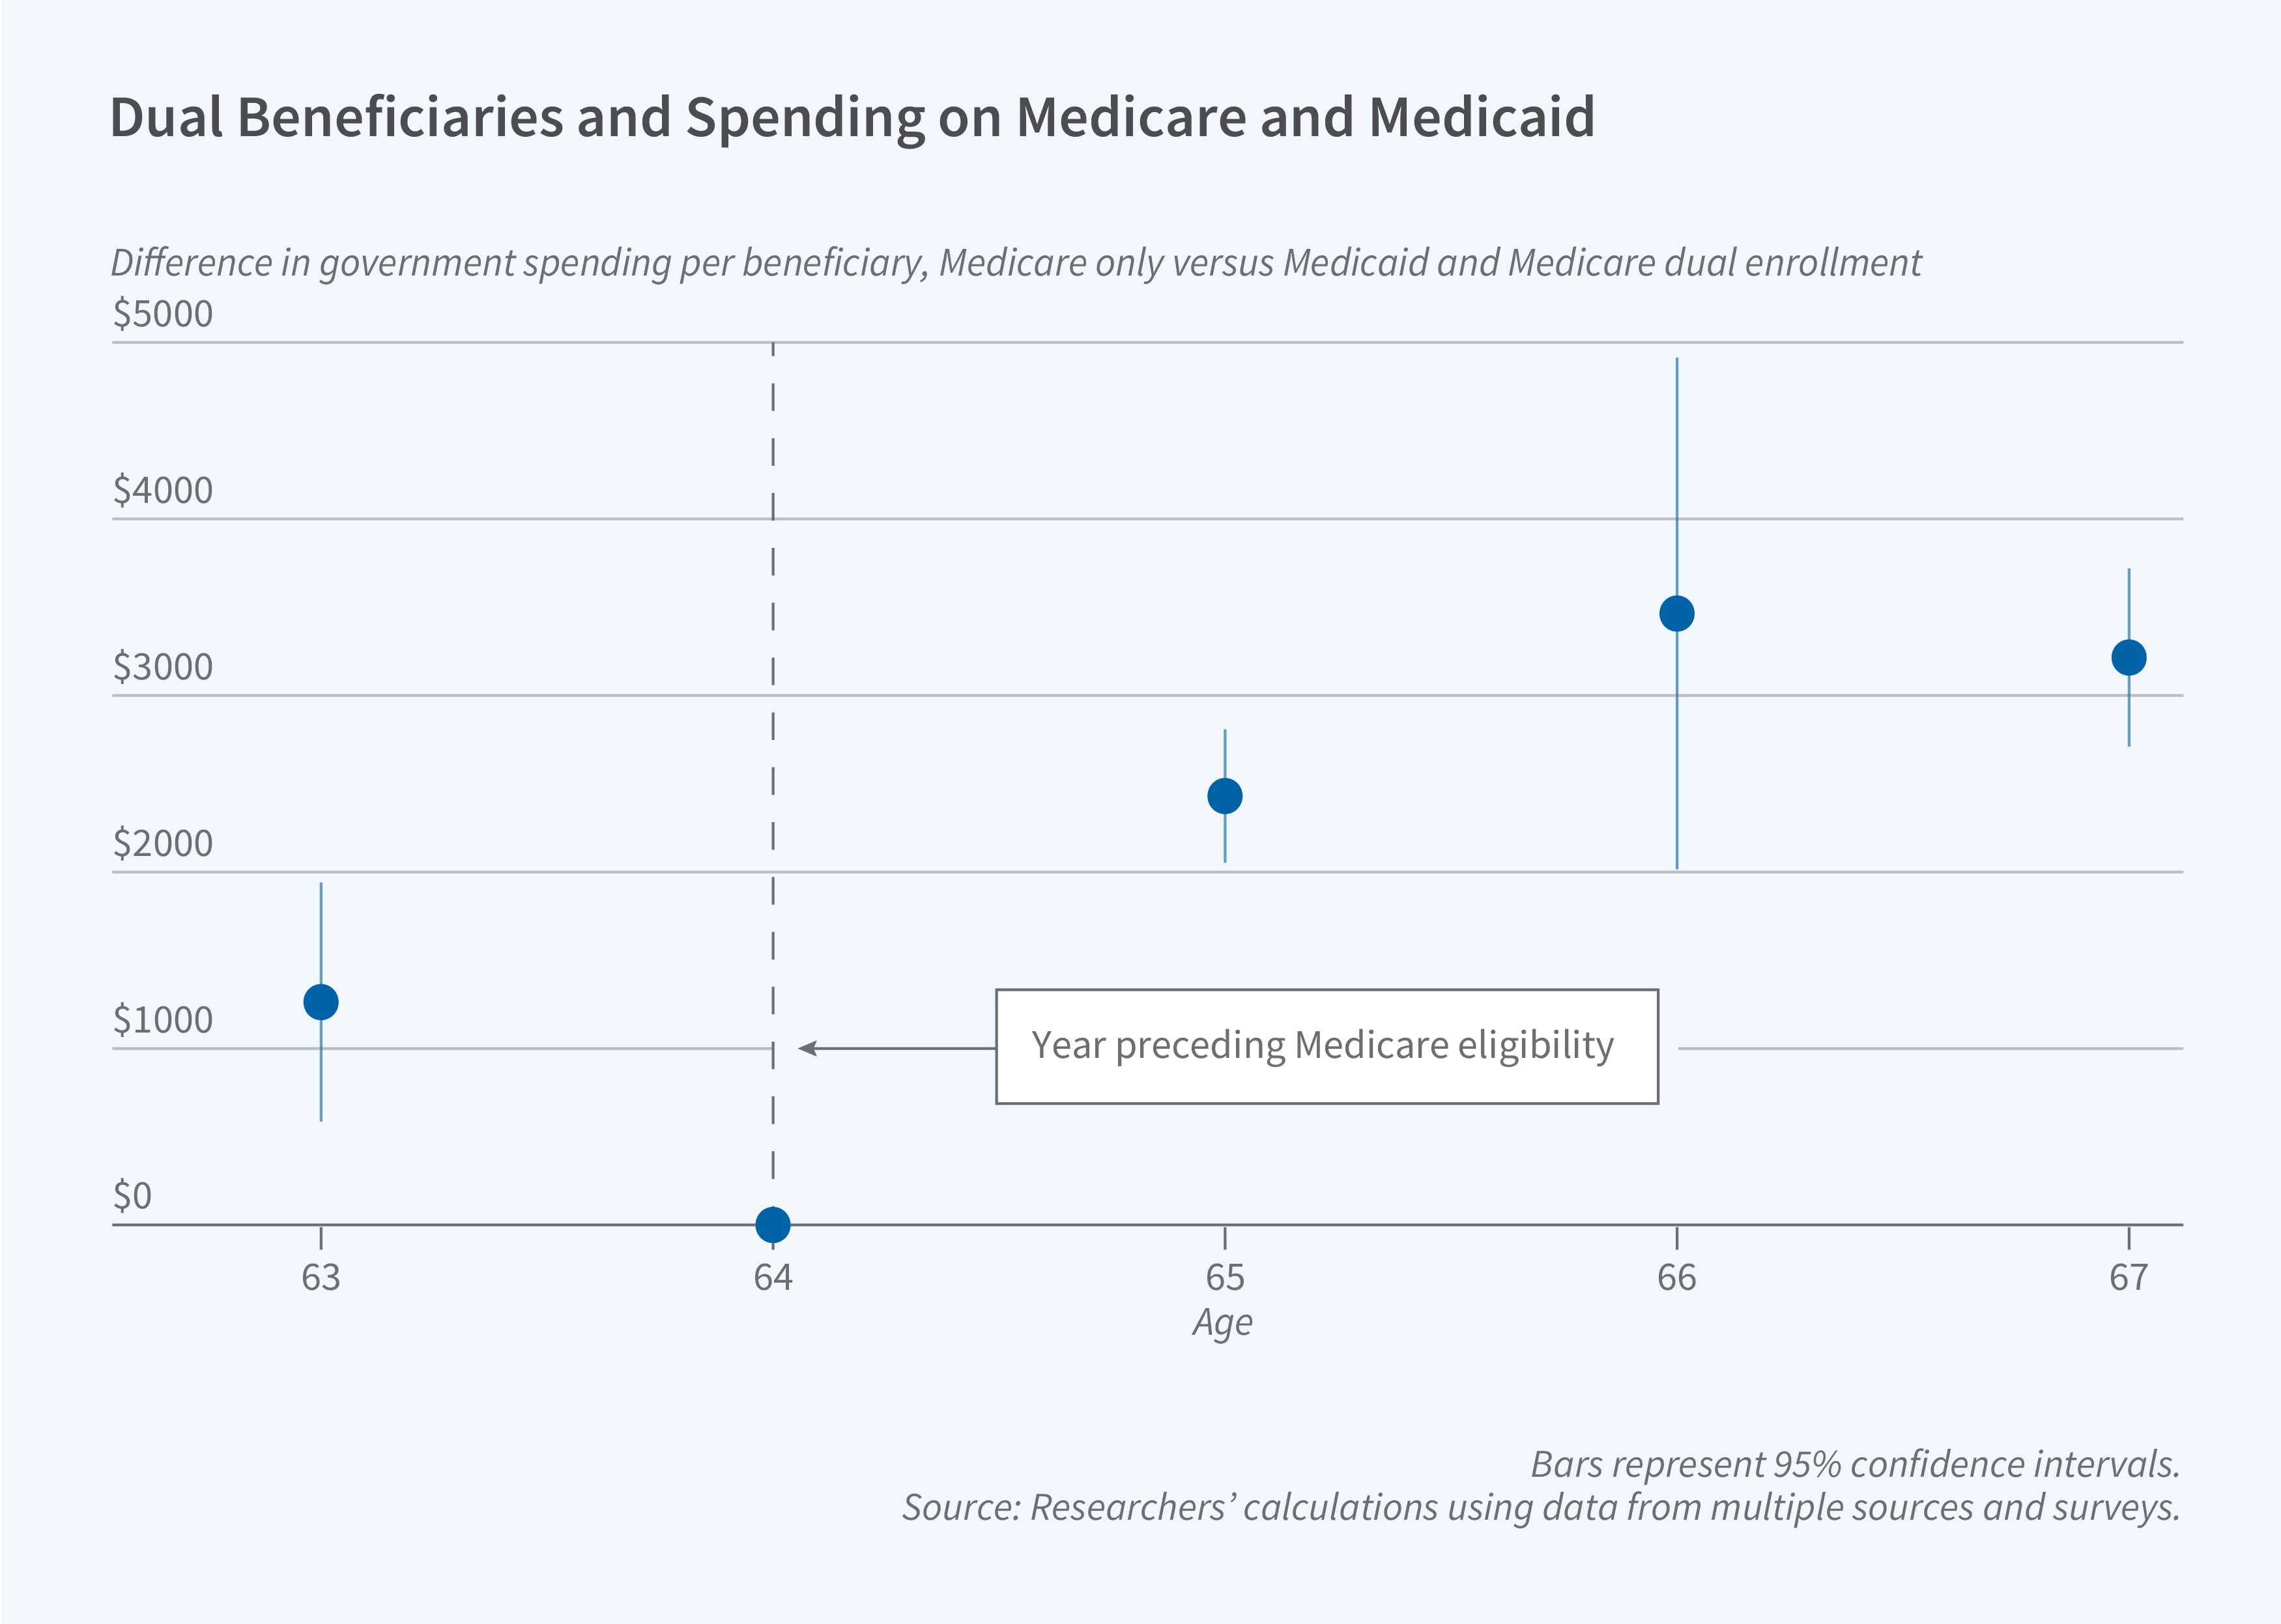
The study, which covers 2008–15, follows individuals who remained in the same state from ages 63 to 67. The treatment group excludes Medicaid beneficiaries who had sufficient work credits to enroll in Medicare before they turned 65. It also excludes beneficiaries who enrolled in Medicare Advantage plans because claims data were not available. To account for trends or changes in outcomes unrelated to Medicare enrollment status, the study employs a comparison group of disabled beneficiaries qualifying for Medicare and Medicaid coverage both pre- and post-65.
After the switch to Medicare, average government spending increased by $2,100 per beneficiary. However, the cost increase was much greater — $3,550 — for the subset of beneficiaries who had been in Medicaid managed care programs. Under managed care, the government pays insurers a lump sum to cover an individual for the year, as opposed to directly paying providers on a fee-for-service basis.
While there was limited change in overall utilization, there was a substantial change in the composition of utilization following the switch. With expanded provider options under Medicare, beneficiaries reduced emergency department visits by nearly 40 percent while increasing physician office visits by 10 percent and overall outpatient utilization by 30 percent. While the shift in Medicare did not significantly reduce the number of hospitalizations, hospital stays were shorter.
– Steve Maas
The research reported herein was performed pursuant to grant RDR18000003 from the US Social Security Administration (SSA) funded as part of the Retirement and Disability Research Consortium. The opinions and conclusions expressed are solely those of the author(s) and do not represent the opinions or policy of SSA, any agency of the Federal Government, or NBER. Neither the United States Government nor any agency thereof, nor any of their employees, makes any warranty, express or implied, or assumes any legal liability or responsibility for the accuracy, completeness, or usefulness of the contents of this report. Reference herein to any specific commercial product, process or service by trade name, trademark, manufacturer, or otherwise does not necessarily constitute or imply endorsement, recommendation or favoring by the United States Government or any agency thereof.


