The Environmental Benefits of OPEC’s Collusive Behavior
The global oil sector accounted for more than 40 percent of anthropogenic CO2 emissions in 2021. The Organization of the Petroleum Exporting Countries’ (OPEC) cartel power restricts oil supply, which in turn reduces the environmental externalities of fossil fuel use. OPEC’s influence on prices also shifts production locations both across cartel members and between cartel members and nonmembers.
In Two Wrongs Can Sometimes Make a Right: The Environmental Benefits of Market Power in Oil (NBER Working Paper 33115), researchers John Asker, Allan Collard-Wexler, Charlotte De Cannière, Jan De Loecker, and Christopher R. Knittel use data from Rystad Energy and engineering estimates of the carbon intensities of oil production in different locations to examine how OPEC’s market power has affected carbon emissions since 1970.
Collusion by OPEC member nations has constrained global oil production, driving up prices and preventing an estimated $4 trillion in emissions-related externalities since 1970.
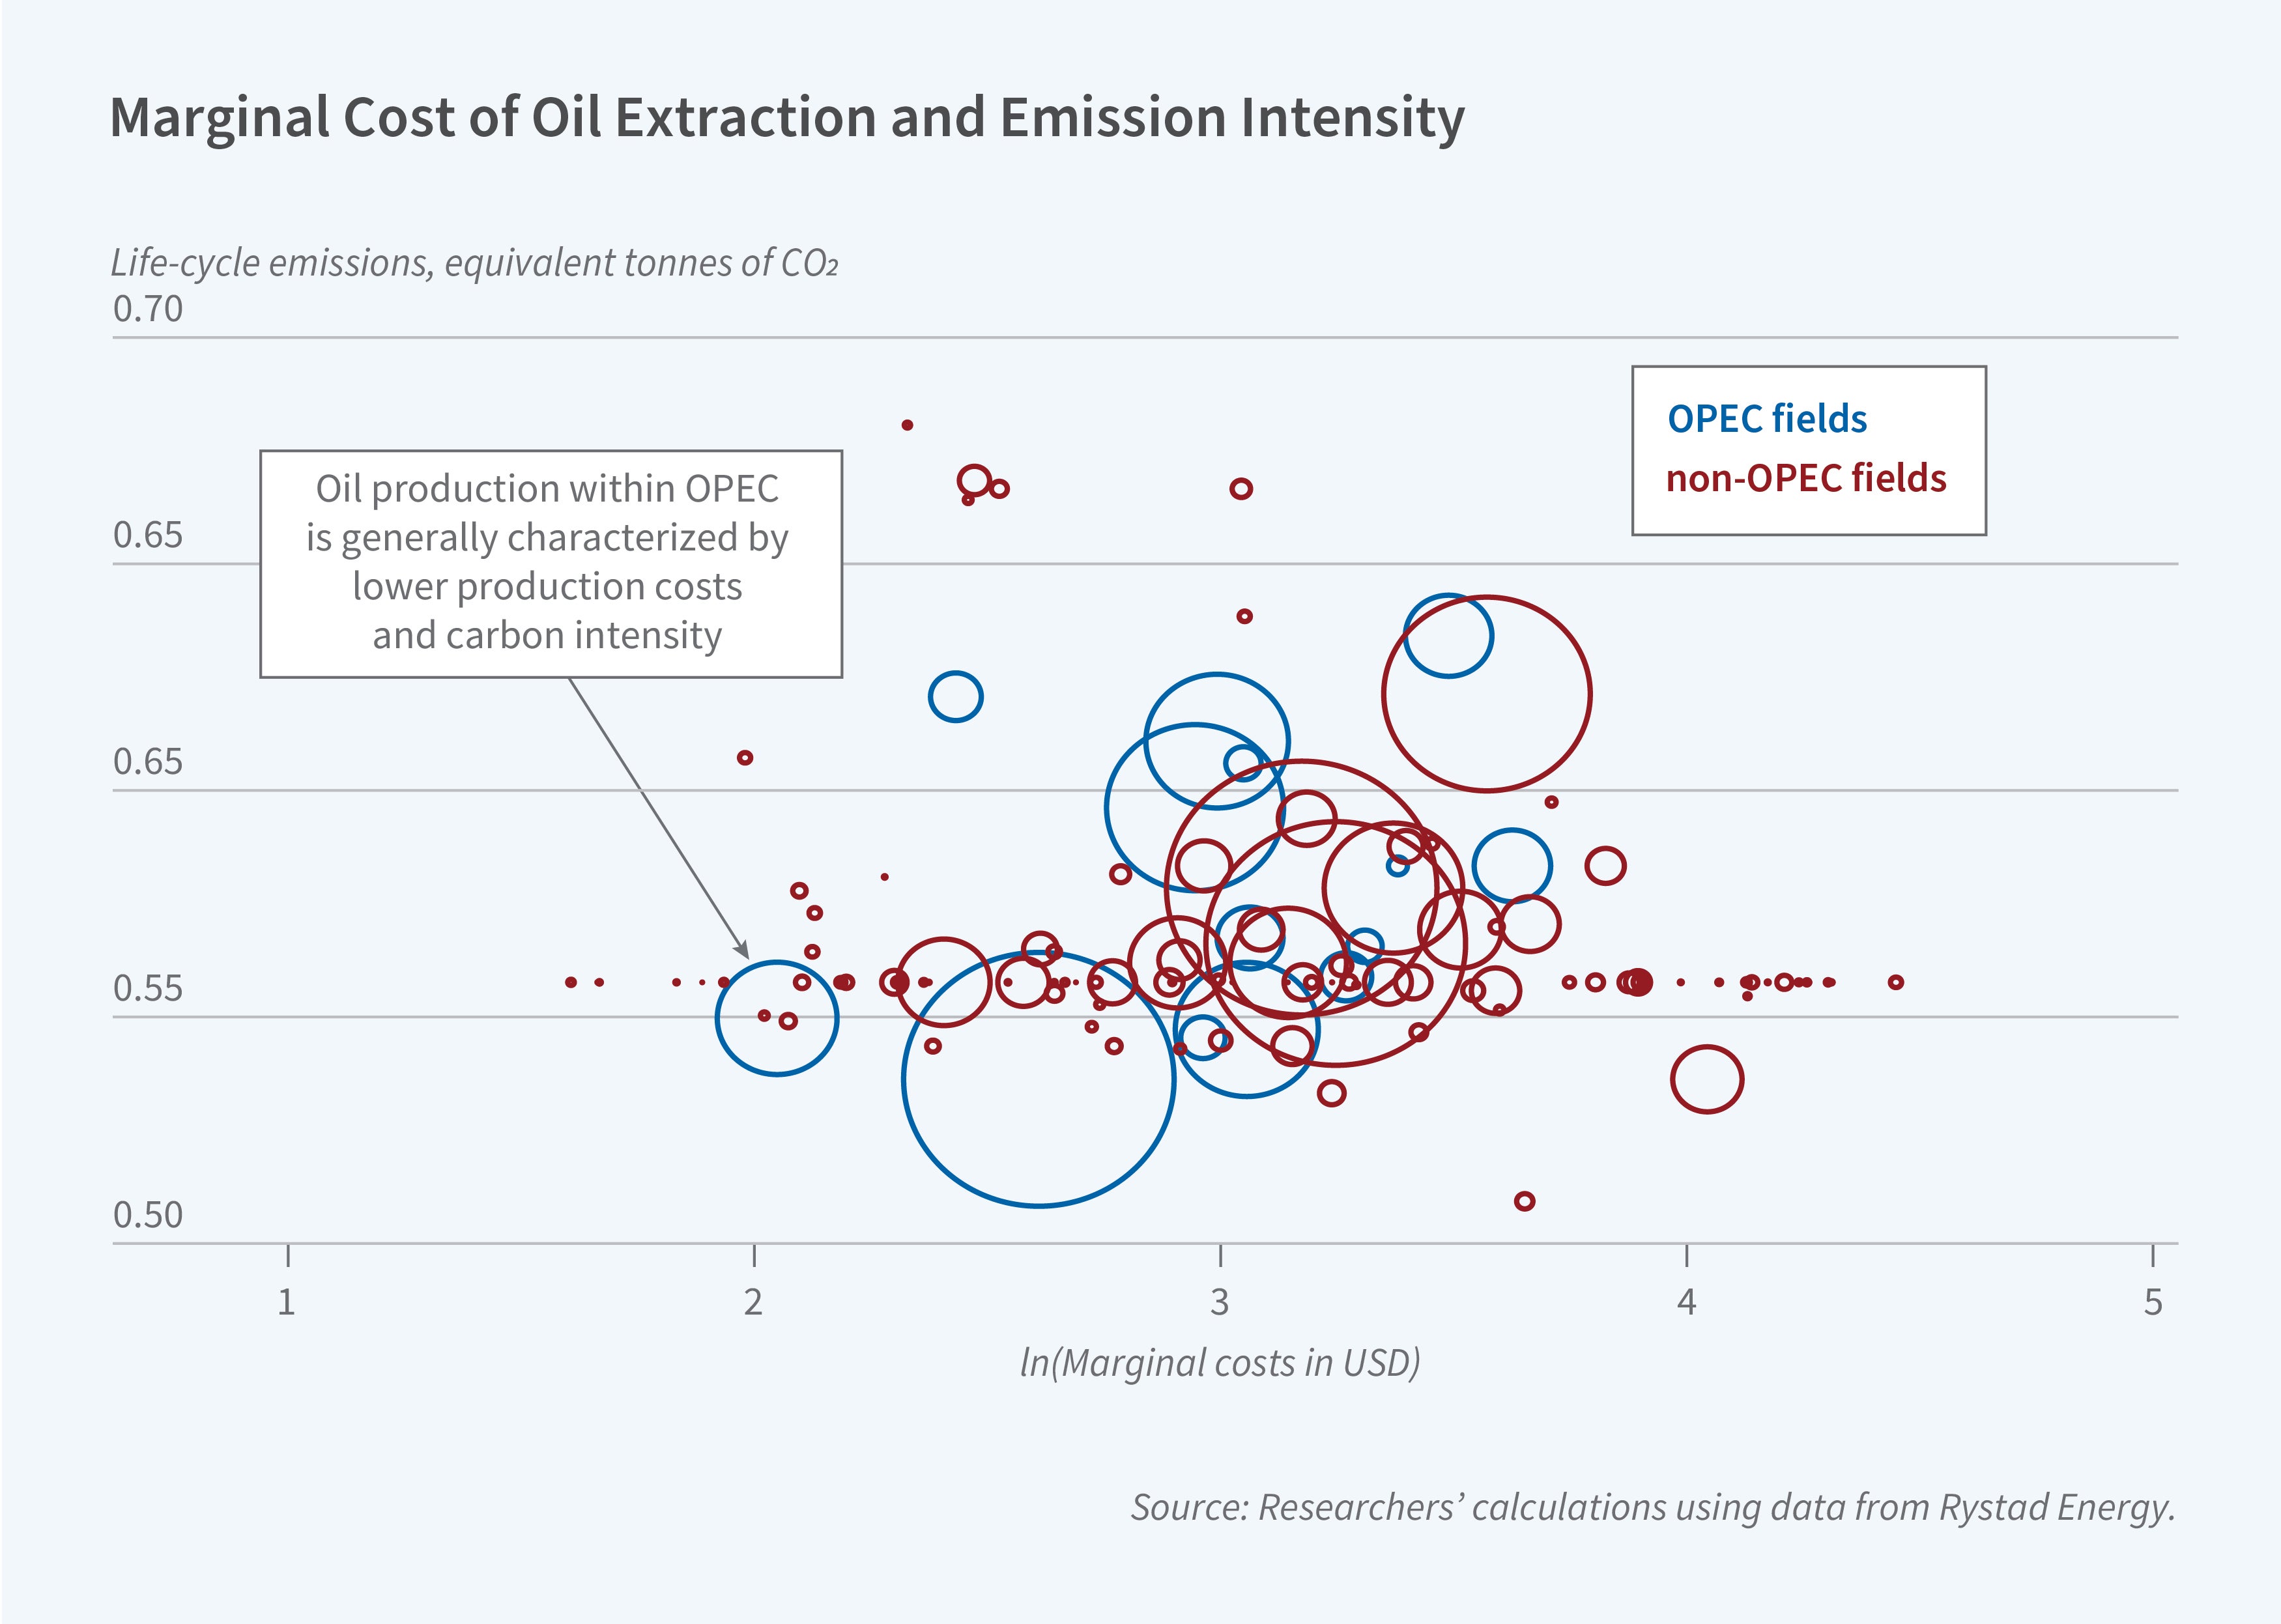
The researchers identify two competing ways market power can affect carbon emissions: the volume effect and the composition effect. The volume effect is the result of OPEC members restricting their production capacity to drive up global oil prices, which reduces overall consumption and thus total emissions. Over 80 percent of oil-related CO2 emissions come from final consumption, not production. The countervailing composition effect is related to the other 20 percent. OPEC quantity restraint shifts production to non-OPEC producers who, on average, employ more energy-intensive oil extraction methods. OPEC countries like Saudi Arabia, Qatar, and the United Arab Emirates emit approximately 0.54 tons of CO2 per barrel of oil during extraction and refining, compared to 0.57 tons in Canada and 0.63 tons in the US. Production costs and carbon intensity are positively related because lower-cost fields generally require less energy for extraction and refining.
The researchers compare the actual history of oil, which reflects OPEC’s market power, to a counterfactual scenario with a competitive oil market. They estimate that OPEC’s market power reduced CO2 emissions by 67.7 billion tons between 1970 and 2021. That is the equivalent of four years of current oil consumption or 1.7 years of total global CO2 emissions. Using a social cost of carbon of about $60 per ton of CO2, this translates to about $4 trillion in avoided environmental damages.
Using the DICE climate model, the authors calculate the OPEC-related reduction in emissions helped to avoid a 0.028°C temperature increase in 2021. The reduction also represents about 18 percent of the remaining carbon budget needed to have a 50 percent chance of meeting the 2015 Paris Agreement’s 1.5°C target.
— Leonardo Vasquez


