Clearing the Air: Historical Air Pollution and Health
Air pollution has serious and longstanding negative effects on human health. The primary focus of research on air pollution in the United States since the enactment of the Clean Air Act Amendments of 1990 has been the health implications of particulate matter. In comparison, there has been relatively little work on air pollution and health in historical periods, even though air pollution was much higher in earlier times than it is today. Research on historical air pollution can provide new evidence on the health consequences of air pollution in the United States and offer insights that may be relevant for policymaking in settings with high levels of air pollution, such as developing countries.
Our research focuses on four topics related to historical air pollution and health: the costs and benefits of expansion of coal-fired power generation as measured by infant mortality from 1938 to 1962; the interaction between historical air pollution and influenza pandemics in 1918, 1957–58, and 1968–69; the costs of the Clean Air Act for the electricity sector; and the benefits to fertility from the declines in airborne lead pollution starting in 1978, when lead was added as a criteria pollutant under the Clean Air Act.
Coal-Fired Electricity and Infant Health
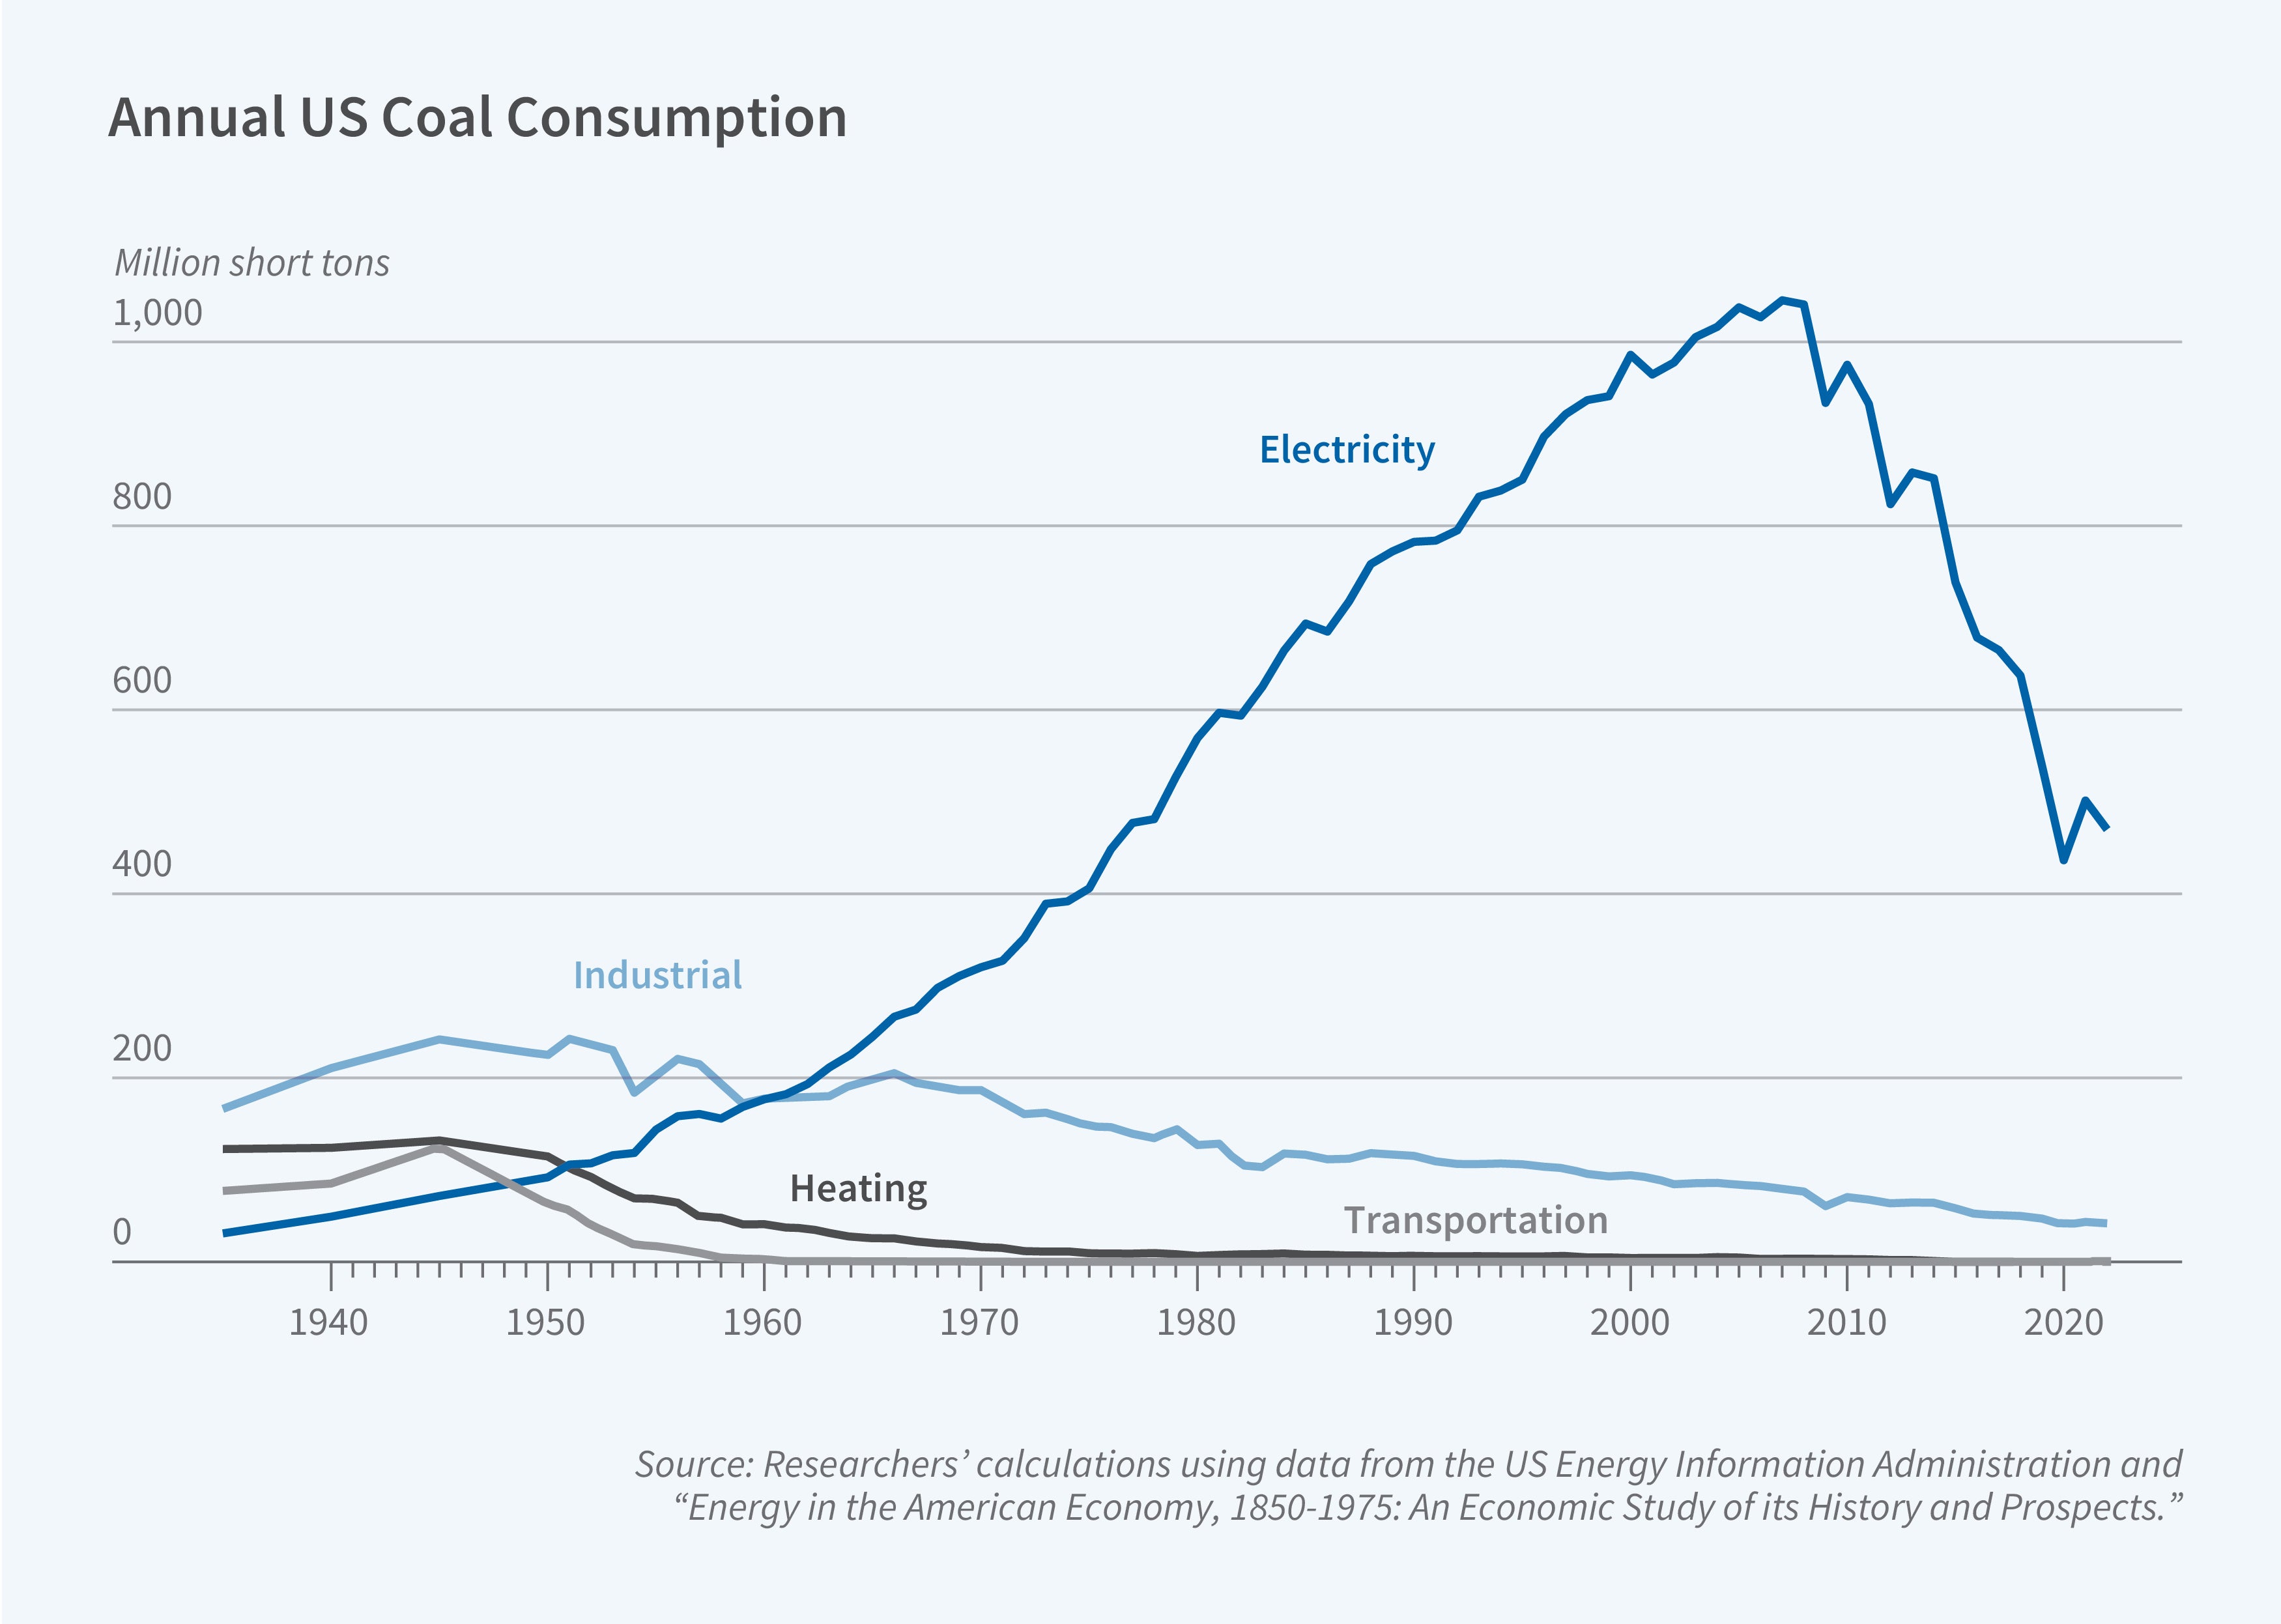
In the early twentieth century, coal was used across a range of sectors and was a major source of air pollution. Evidence summarized in a paper with Joshua Lewis shows that air pollution in cities was high.1 Newspaper articles decried those high levels, and cities passed local legislation aimed at addressing the pollution problem. Local legislation was, by all accounts, ineffective.
Figure 1 shows the increase in coal consumption by the electricity sector over time and high levels of consumption by the industrial sector before 1970. Nearly all the coal was being burned without emissions controls, so more coal consumption translated into more air pollution. Air pollution in some areas became increasingly severe. This eventually led to the passage of federal legislation in 1955 and 1963 and to the Clean Air Act of 1970.
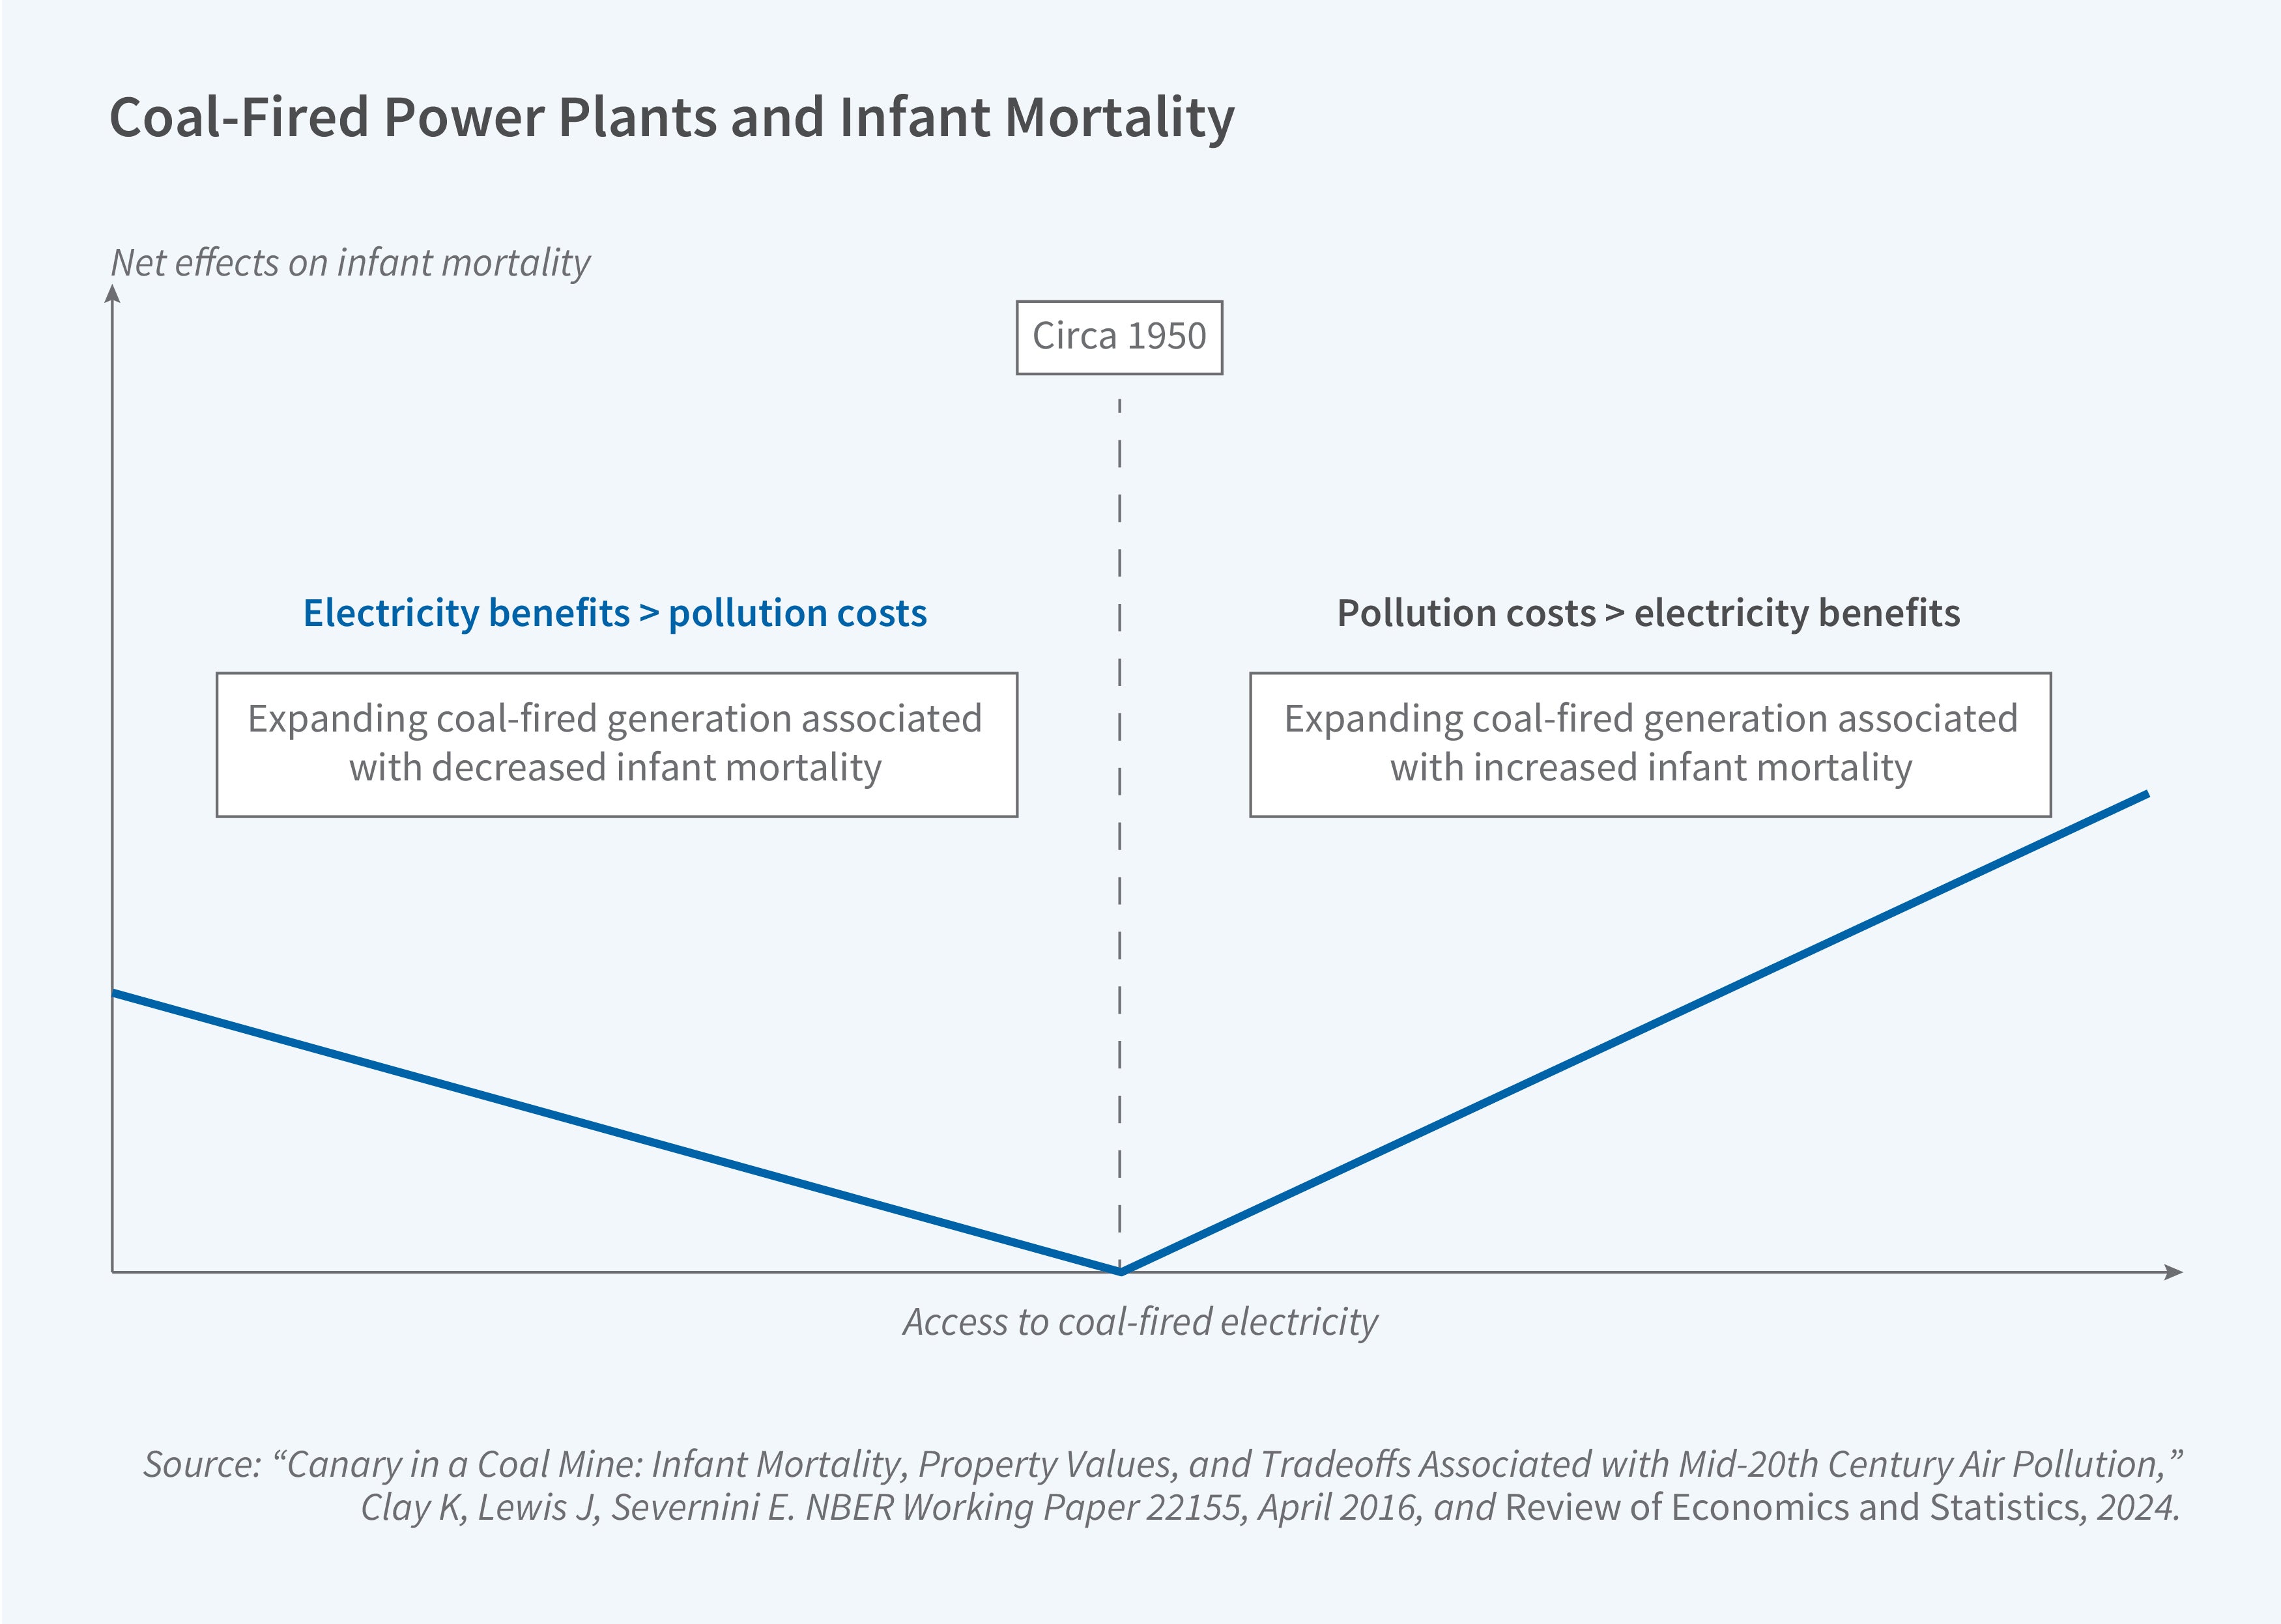
In other work, we investigate the trade-offs involved in the historical expansion of coal-fired electricity generation in the United States, particularly focusing on its health implications.2 During the mid-twentieth century, the surge in coal-fired power generation played a pivotal role in local industrial growth and household electrification. However, this expansion also resulted in significant air pollution, raising concerns about its adverse health effects. By analyzing newly digitized data on coal-fired power plants alongside county-level infant mortality rates from 1938 to 1962, we shed light on the relationship between coal-fired generation, electricity access, and infant health.
Our study identifies a striking reversal in the relationship between coal-fired generation and infant mortality around 1950. Initially, coal-fired generation was associated with decreased infant mortality due to expanded electricity access and economic benefits, as shown in Figure 2. However, as the existing capacity of local generating facilities expanded and air pollution increased, the net health impact of expanding coal-fired generation turned negative. Our research finds that while coal-fired capacity expansions led to improvements in household electrification and modest employment growth, the overall health impacts were influenced by the level of exposure to plant emissions. These findings highlight the importance of policy evaluations of infrastructure investments over a long time horizon.
Our study also uncovers substantial heterogeneity in health outcomes based on baseline electricity access levels and local exposure to plant emissions. Counties with low initial access to electricity experienced no significant increase in infant mortality, suggesting that the benefits of expanded electricity generation might have outweighed the health costs of air pollution. Conversely, in counties with high baseline electricity access, coal capacity expansions were associated with a notable rise in infant mortality, demonstrating pollution-related health risks.
Air Pollution and Influenza Pandemics
One important way pollution can cause death is through its interaction with infectious disease. The consequences of pollution are likely to be particularly significant during pandemics, such as those associated with influenza.
In joint work with Lewis, we examine excess mortality during the 1918 influenza pandemic.3 Using a panel dataset covering infant and all-age mortality rates in 180 US cities from 1915 to 1925, our study links mortality to coal-fired electricity generation, which was a significant source of urban air pollution at the time. Employing a difference-in-differences approach, the analysis reveals that cities with higher coal usage experienced substantial increases in both infant and all-age mortality during the pandemic compared to cities with lower coal usage, resulting in an estimated 30,000 to 42,000 additional deaths attributed to pollution — 19 to 26 percent of total pandemic mortality. These findings underscore air pollution’s contribution to the severity of the 1918 influenza pandemic, highlighting the importance of considering environmental factors in pandemic preparedness and response strategies.
In work with Lewis and Xiao Wang, we show that the introduction of Medicaid in 1965 significantly mitigated air pollution impacts on infant mortality during the 1968–69 influenza pandemic.4 Drawing on the newly digitized data on coal-fired power plants mentioned previously, we use coal-fired electricity generation as a proxy for air pollution. Analyzing county-level infant mortality data from 1950 to 1976, we employ a triple-difference estimation strategy to assess the deviation from trend in infant mortality during the 1968–69 pandemic across counties with varying exposure levels to the Medicaid expansion and differing Medicaid eligibility across states. The effects are quantitatively significant, with the introduction of Medicaid estimated to have averted over 2,500 infant deaths nationwide during the 1968–69 pandemic, suggesting a broader local health externality wherein improved healthcare access reduced disease transmission within the population.
The Clean Air Act of 1970
The environmental and health impacts of polluting activities led to the passage of the Clean Air Act (CAA) in 1970. A long-standing question about the costs of the CAA is its impact on key sectors like electricity. In work with Akshaya Jha and Lewis, we call attention to the importance of accounting for anticipatory behavior by polluting firms when assessing these impacts.5 By leveraging the new dataset on fossil-fuel power plant use spanning 1938 to 1994, we uncover significant anticipatory responses by electric utilities. Nonattainment designations under the CAA resulted in substantial and enduring decreases in productivity among coal-fired power plants, particularly those built before the 1963 CAA that signaled impending federal regulation but was difficult to enforce. The strategic responses of utilities are evident in the design and siting decisions of plants constructed after 1963. We find that the aggregate productivity losses and the associated costs of the CAA borne by the power sector were substantially mitigated by the reallocation of output away from older, less-productive power plants.
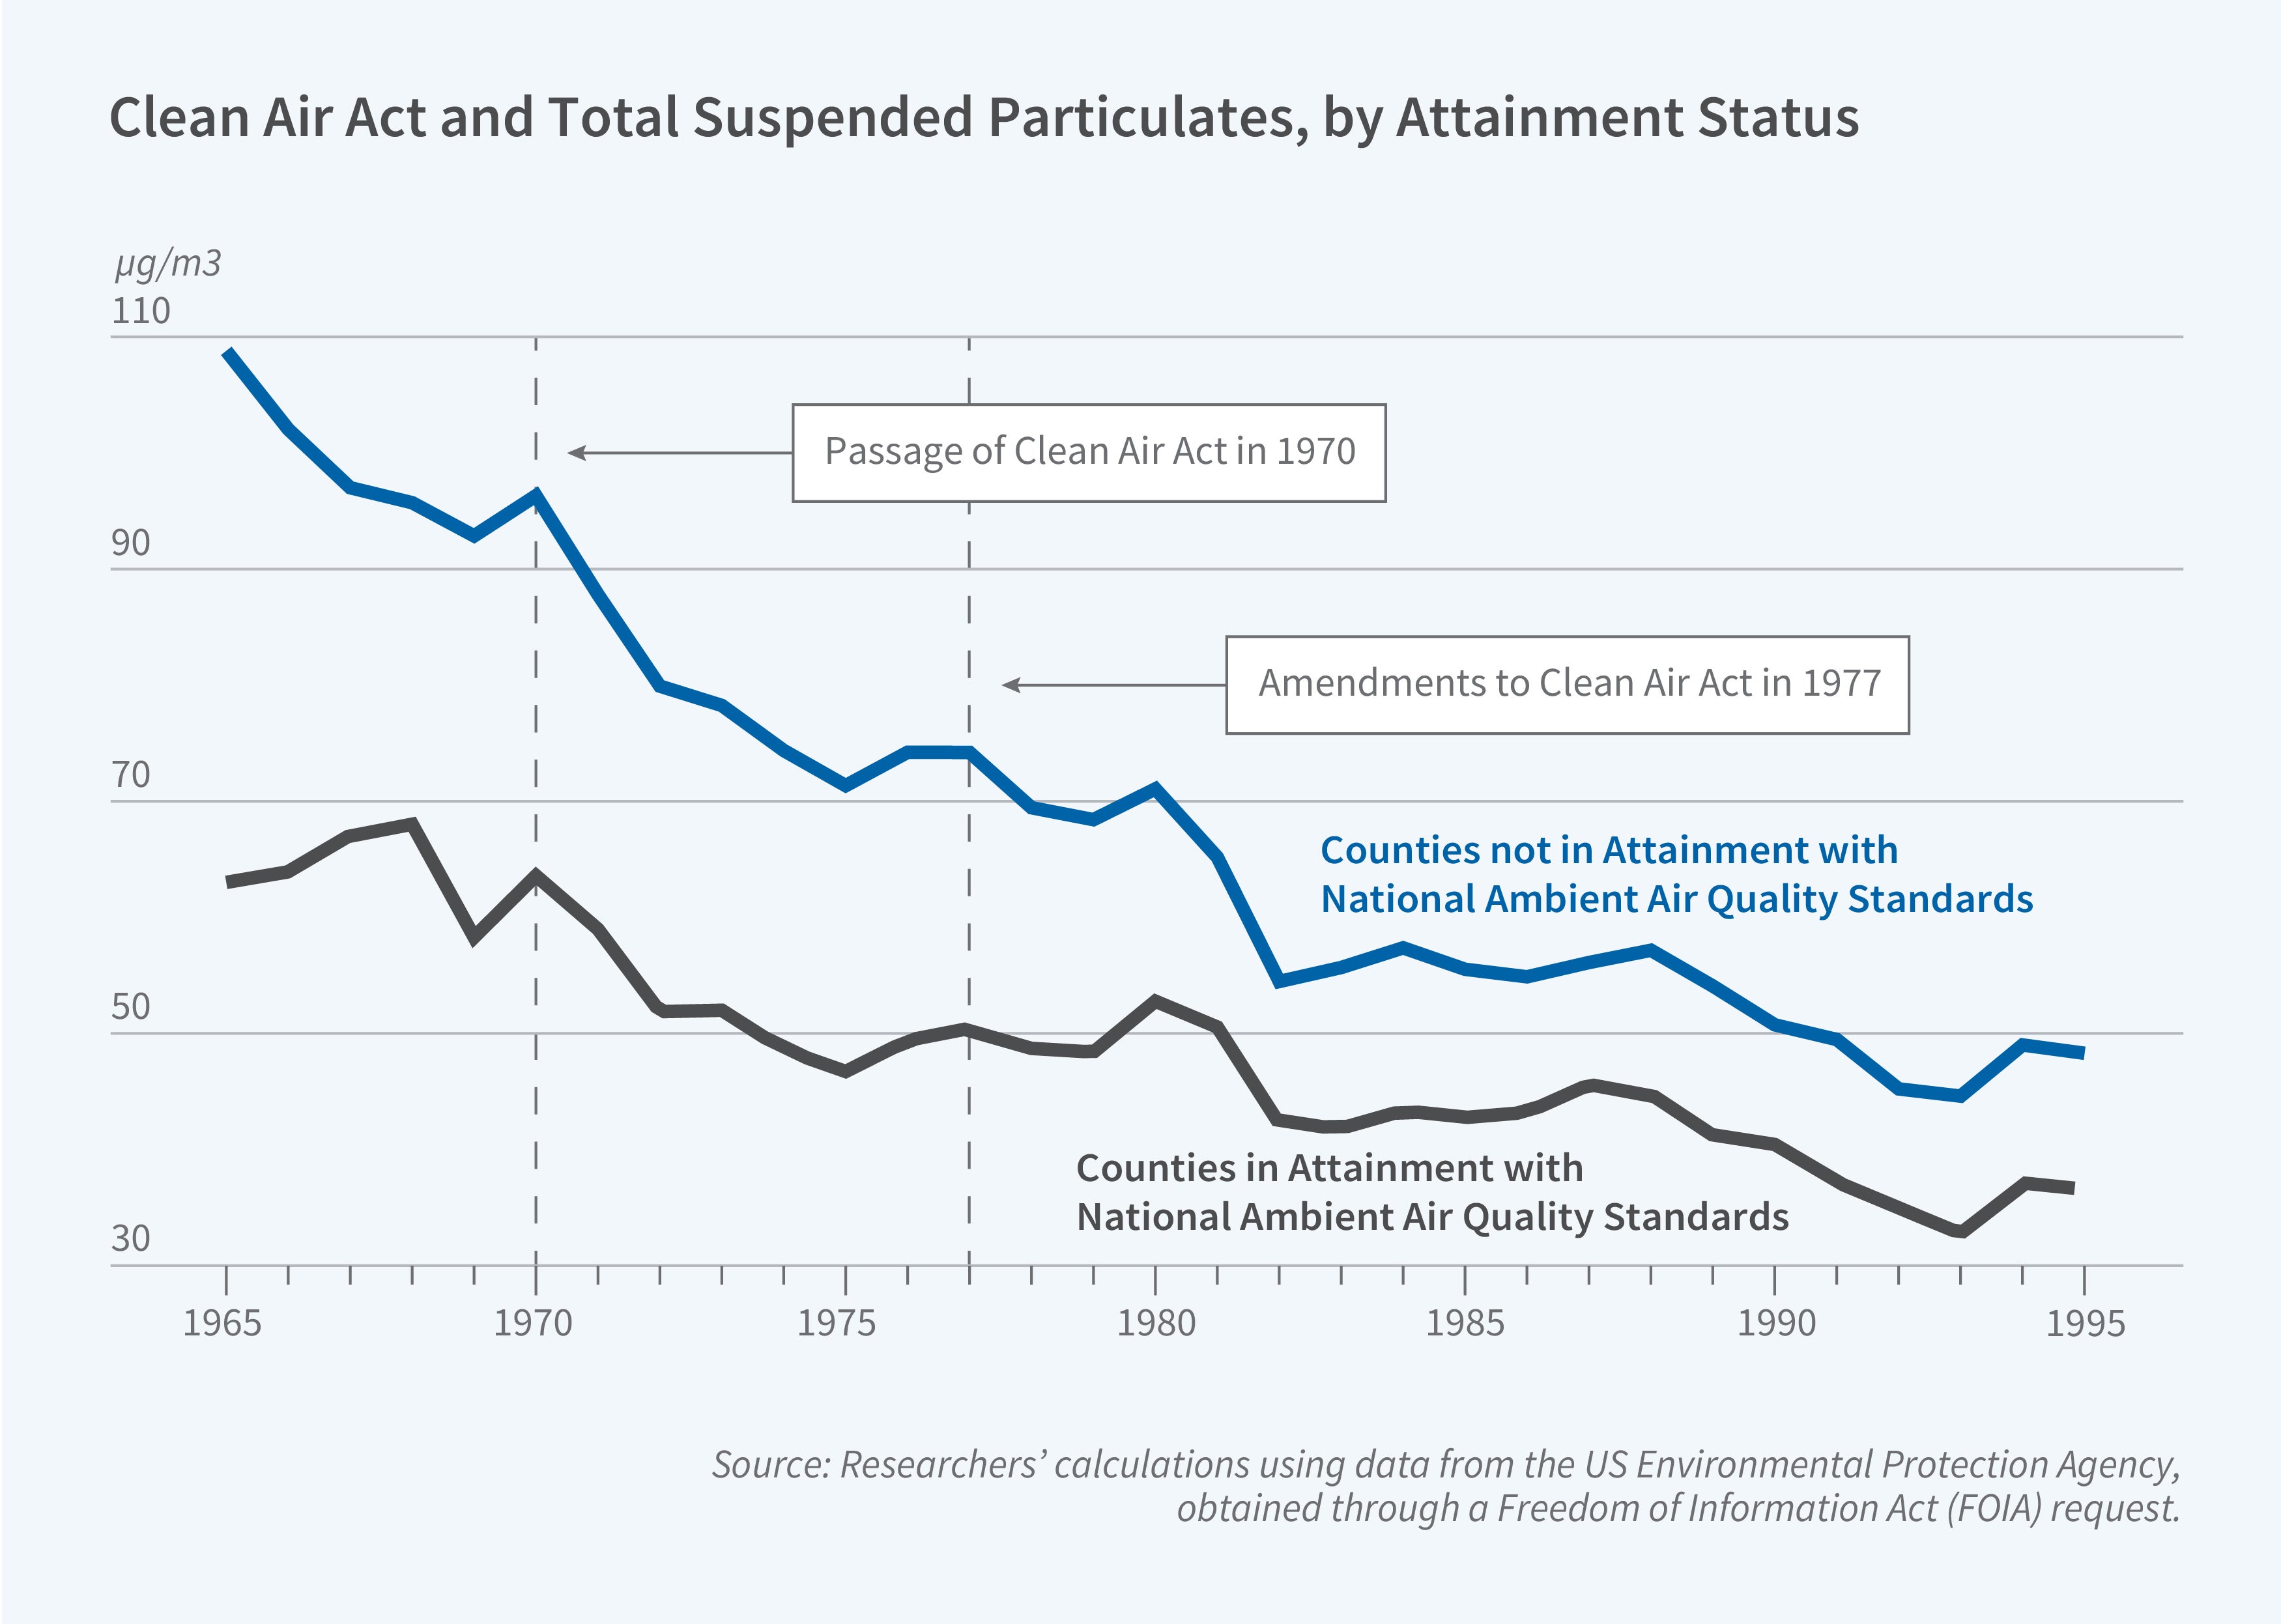
Anticipation has implications for understanding the effects of the CAA on air pollution and in turn on health. Figure 3 shows that the level of total suspended particulates (TSP) was already falling prior to the 1970 CAA. Under the CAA, counties were designated as in or out of attainment with National Ambient Air Quality Standards. It also shows that the reduction in TSP levels in nonattainment counties surpassed that of attainment counties following the 1977 amendments. When Maureen Cropper, Nicholas Muller, Yongjoon Park, and Victoria Perez-Zetune examined whether nonattainment counties experienced larger TSP reductions in the 1970s compared to attainment counties, they found that the parallel trends assumption, crucial for causal inference in difference-in-differences analysis, had been violated.6 Anticipation might explain these preexisting trends.
Air Lead Pollution
Originally, the US Environmental Protection Agency (EPA) regulated five criteria pollutants under the 1970 CAA — particulate matter, ambient ozone, carbon monoxide, nitrogen dioxide, and sulfur dioxide. Following a lawsuit by the Natural Resources Defense Council, the EPA in 1978 established National Ambient Air Quality Standards for airborne lead. Lead is a highly toxic metal known to cause a range of adverse health outcomes, particularly in children and fetuses. In adults, lead exposure has been linked to hypertension, cardiovascular disease and mortality, miscarriages, and damage to the reproductive system.
In work with Alex Hollingsworth, we review the surprisingly small quasi-experimental literatures on lead and fertility, lead and infant mortality, and lead and infant birth outcomes.7 Our research with Margarita Portnykh examines the impact of airborne lead on fertility rates using US county-level data from 1978 to 1988.8 Over this period, airborne lead exposure decreased due to regulatory efforts to reduce air pollution, particularly lead emissions from gasoline. The study provides the first causal evidence of a relationship between lead exposure and fertility rates in the general population. Instrumental variable estimates indicate that a decrease in airborne lead levels caused an increase in both the general fertility rate and the completed fertility rate, equivalent to about six percent of mean fertility. Additionally, we explore the relevance of these findings more recently by estimating the effect of historically accumulated lead in topsoil on fertility in the 2000s, revealing that counties with higher lead concentrations in their soil had significantly lower general fertility rates. This finding suggests that lead exposure may continue to impact fertility today, not only in the United States but in other countries with significant lead contamination in the air and topsoil.
Conclusion
The research summarized here provides new evidence on historical air pollution and health in the United States. Because the analysis of air pollution and other types of pollution in US history is relatively new, there are many opportunities for additional research. One advantage of working on the US topics is that there are data spanning relatively long periods of time, including periods without and with regulation. Further, historical pollution levels in the US were high and so are more similar to levels in developing countries than they are to contemporary pollution levels. Thus, research on historical pollution can both quantify the costs and benefits of historical policies pertaining to air pollution in the US and offer insights that may be relevant for policymaking in developing countries.
Endnotes
“The Historical Impact of Coal on Cities,” Clay K, Lewis JA, Severnini ER. NBER Working Paper 31365, June 2023, and Regional Science and Urban Economics 107, July 2024, Article 103951.
“Canary in a Coal Mine: Infant Mortality, Property Values, and Tradeoffs Associated with Mid-20th Century Air Pollution,” Clay K, Lewis J, Severnini ER. NBER Working Paper 22155, April 2016, and Review of Economics and Statistics 106(3), May 2024, pp. 698–711.
“Pollution, Infectious Disease, and Mortality: Evidence from the 1918 Spanish Influenza Pandemic,” Clay K, Lewis J, Severnini ER. NBER Working Paper 21635, May 2018, and Journal of Economic History 78(4), October 2018, pp. 1179–1209.
“The Value of Health Insurance during a Crisis: Effects of Medicaid Implementation on Pandemic Influenza Mortality,” Clay K, Lewis JA, Severnini ER, Wang X. NBER Working Paper 27120, May 2022, and Review of Economics and Statistics 1-31, September 2022.
“Impacts of the Clean Air Act on the Power Sector from 1938–1994: Anticipation and Adaptation,” Clay K, Jha A, Lewis JA, Severnini ER. NBER Working Paper 28962, December 2022.
“The Impact of the Clean Air Act on Particulate Matter in the 1970s,” Cropper M, Muller N, Park Y, Perez-Zetune V. Journal of Environmental Economics and Management 121, September 2023, Article 102867.
“The Impact of Lead Exposure on Fertility, Infant Mortality, and Infant Birth Outcomes,” Clay K, Hollingsworth A, Severnini ER. NBER Working Paper 31379, June 2023, and forthcoming in the Review of Environmental Policy and Economics.
“Toxic Truth: Lead and Fertility,” Clay K, Portnykh M, Severnini ER. NBER Working Paper 24607, June 2019, and Journal of the Association of Environmental and Resource Economists 8(5), September 2021, pp. 975–1012.


