The Challenging Transition from Investment- to Consumption-Led Growth in China
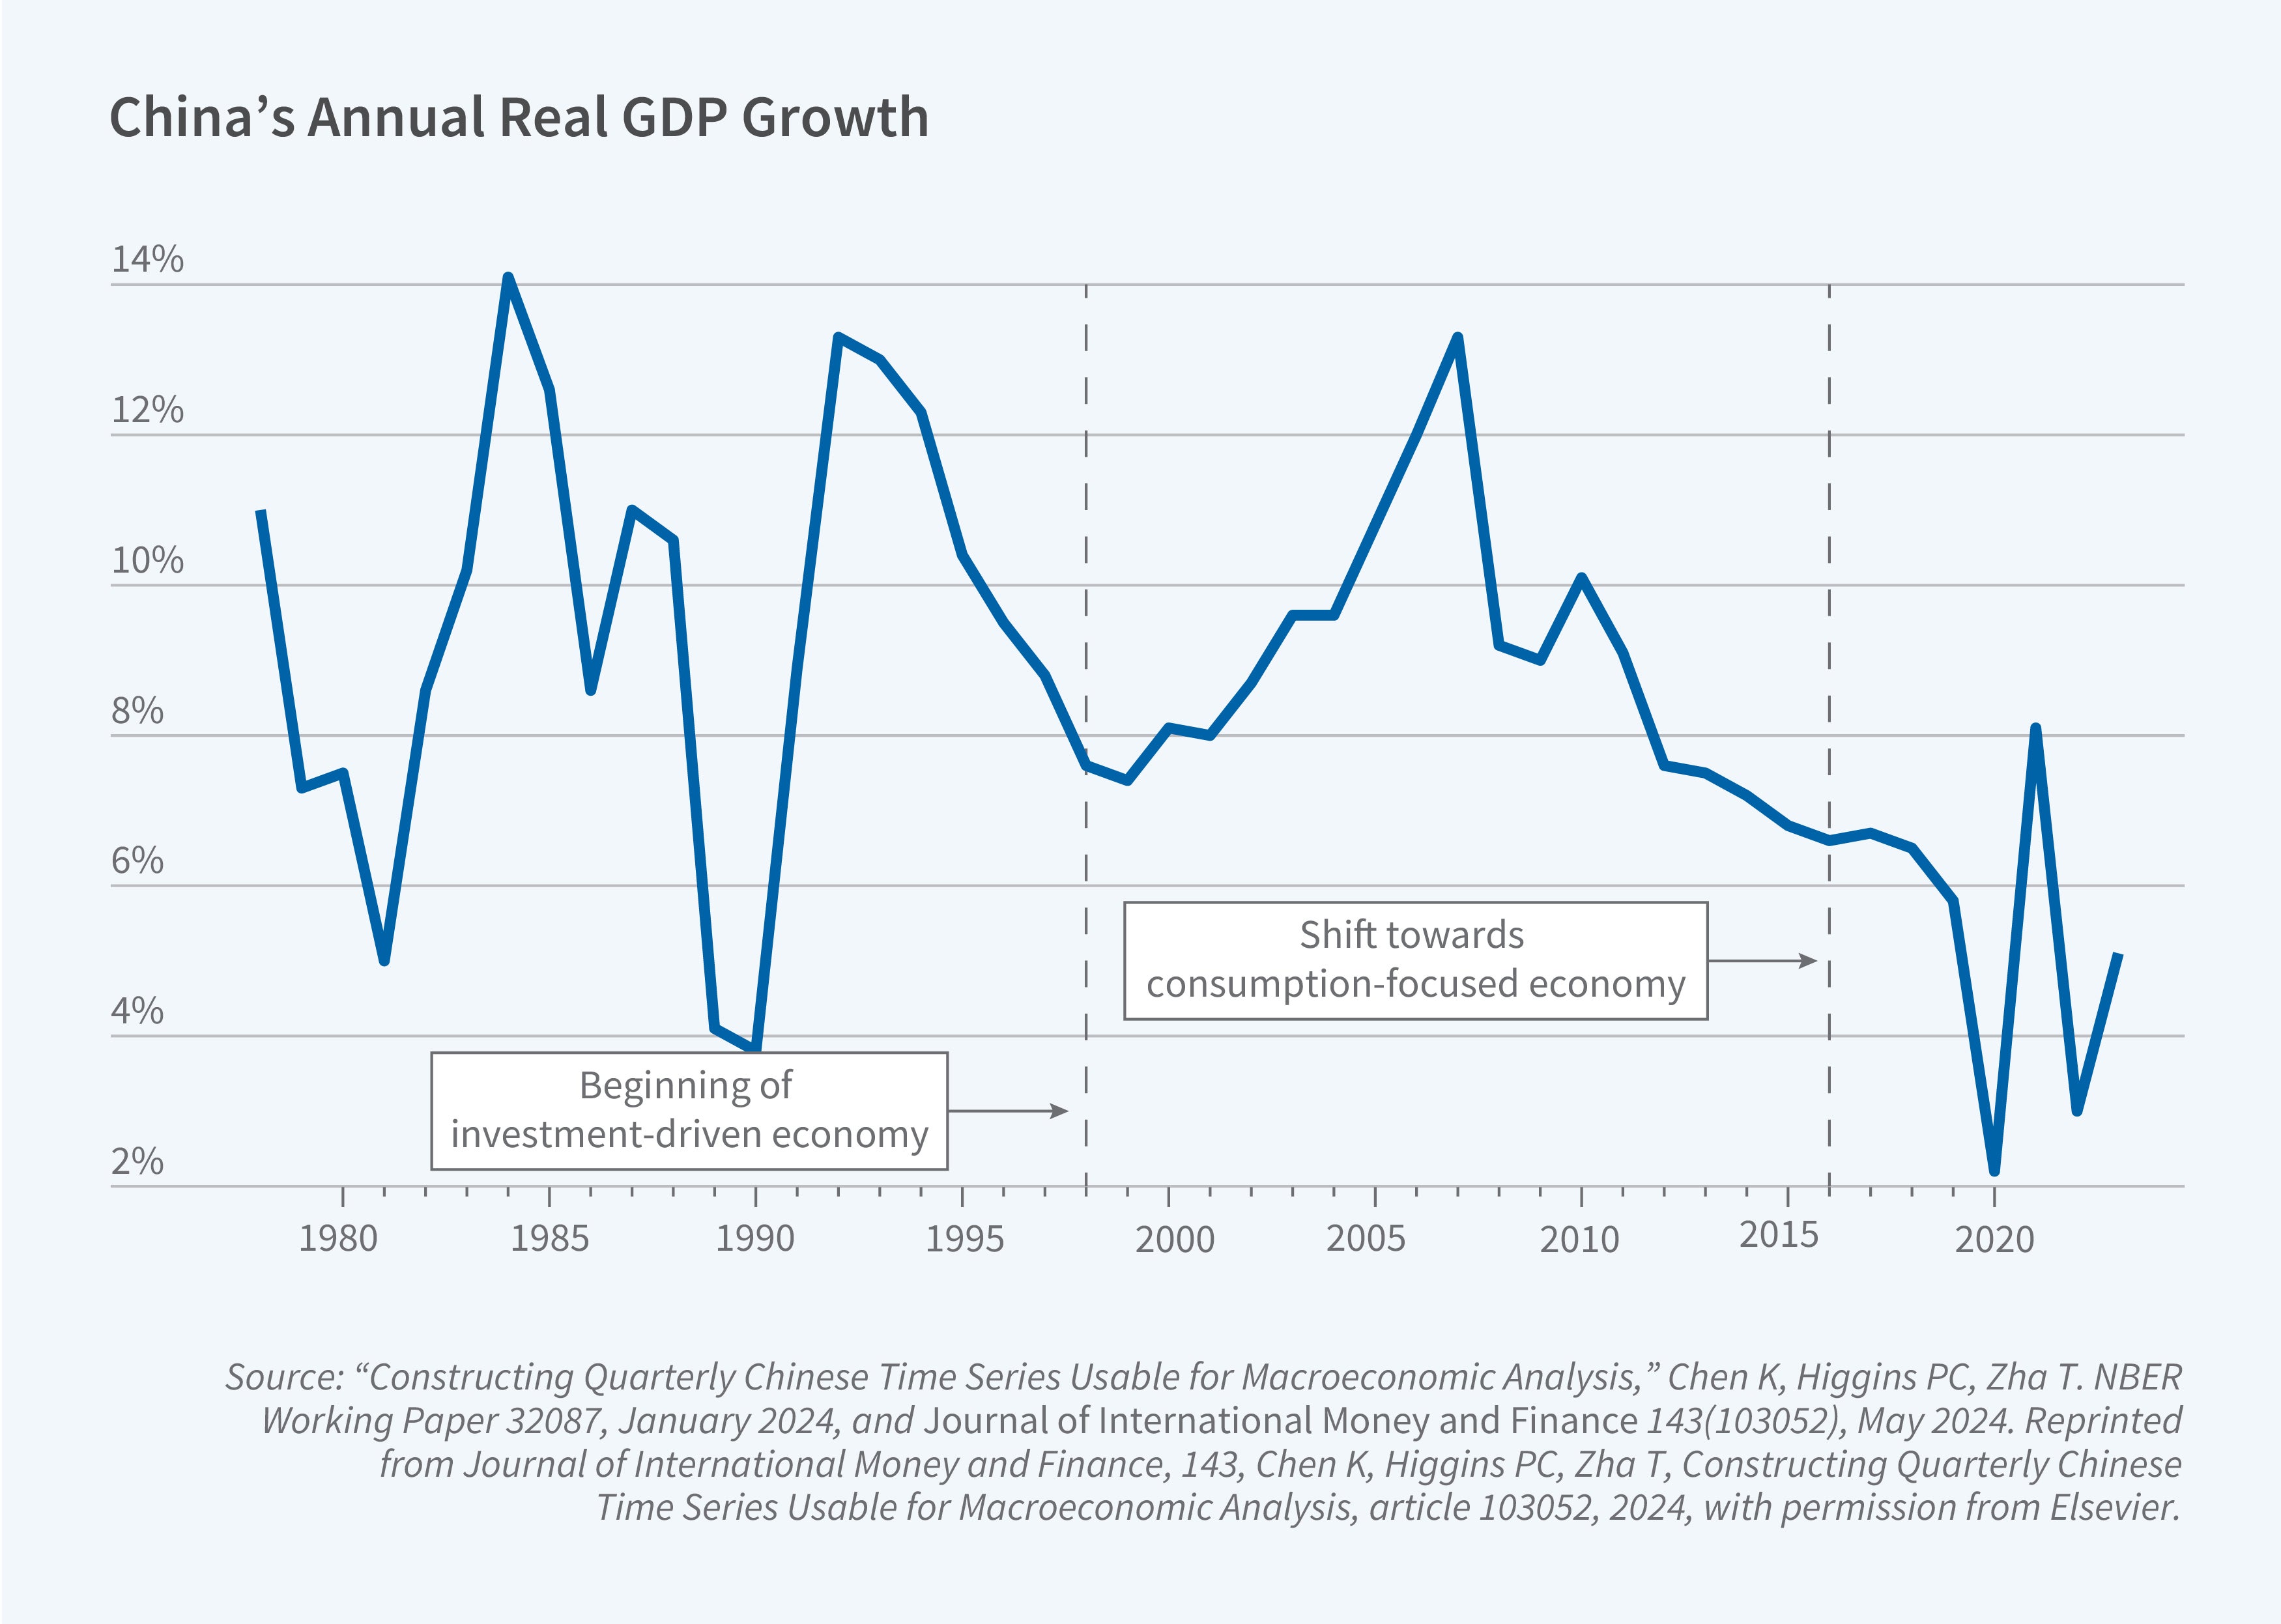
Miraculous growth has been China’s hallmark for decades. In recent years, however, China’s gross domestic product (GDP) growth rate has slowed down considerably [See Figure 1]. Never has this change been more evident than after the COVID-19 crisis, when the government periodically locked down the entire economy. A series of my recent research papers with Kaiji Chen and other collaborators provides a glimpse into how China achieved its miraculous growth, what caused its slowdown, and the headwinds it faces.

Rise of an Investment-Driven Economy
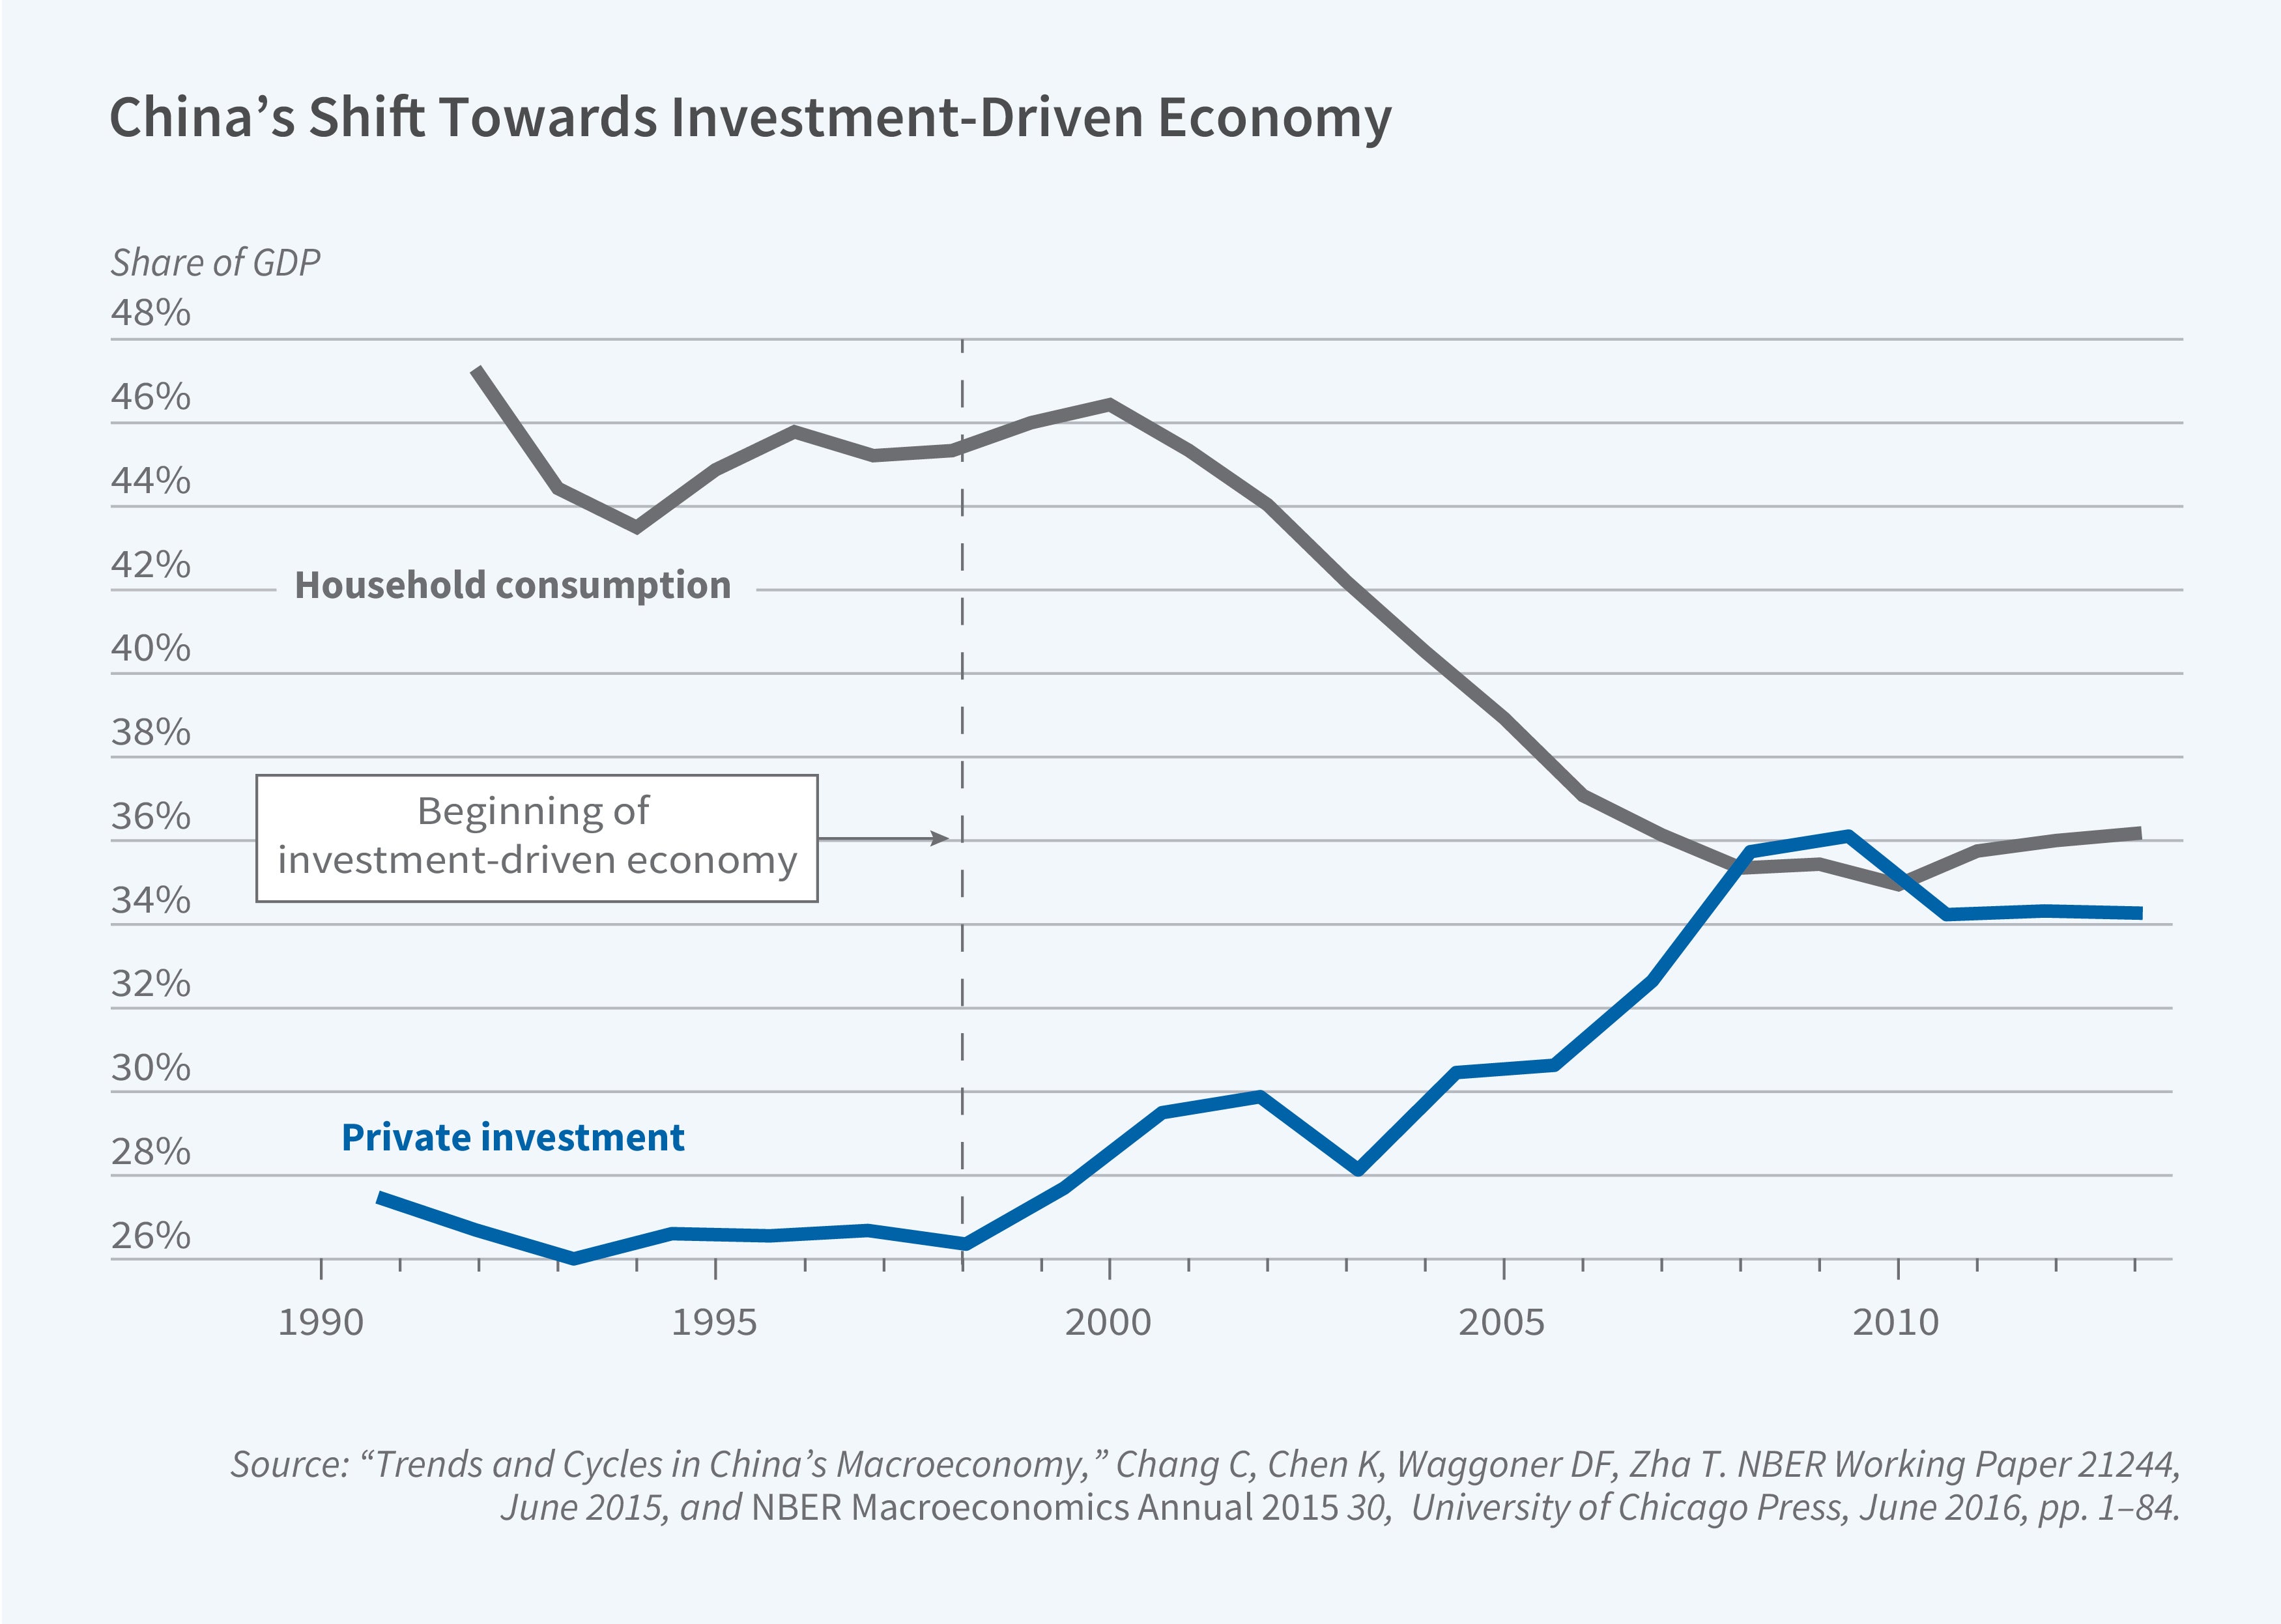
The sources of China’s GDP growth have changed over time. Growth of total factor productivity (TFP) was a main driver of growth during 1978–97, contributing to 56.6 percent of GDP growth per worker. In the period 1998–2015, however, investment — capital deepening — played a dominant role, contributing to 68.3 percent of GDP growth.1 The government provided preferential credit to large, capital-intensive firms, whether state-owned enterprises (SOEs) or privately owned enterprises (POEs), as long as they contributed to GDP growth. During this period, the ratio of real estate investment to GDP steadily increased from 4 percent in 2000 to around 10 percent in 2014, and the contribution of business investment, particularly in service sectors, increased steadily from 26.3 percent in 2000 to 36 percent in 2010.2 China witnessed a steady increase in the aggregate investment-to-GDP ratio and a decline in both the consumption-to-GDP ratio and the labor income share during the first decade of the 2000s. Private investment in both large and small enterprises was a crucial pillar of the Chinese economy in this period. The share of investment by POEs increased to about 70 percent in 2008, up from 30 percent in 1998, and the investment-to-GDP ratio increased steadily.
To explain this phenomenon, we construct a theoretical two-sector model with different capital intensities and asymmetric credit access between firms in labor-intensive and capital-intensive sectors. We explore what happens when the government provides credit support for large, capital-intensive firms, regardless of whether they are SOEs or POEs. Under standard assumptions about production technologies, firms receiving such preferential support have an incentive to expand production along the transition path due to the positive interaction between the credit support they receive and the firms’ collateral values. Consequently, capital is reallocated from labor-intensive to capital-intensive sectors, which explains the pattern observed after 1998.

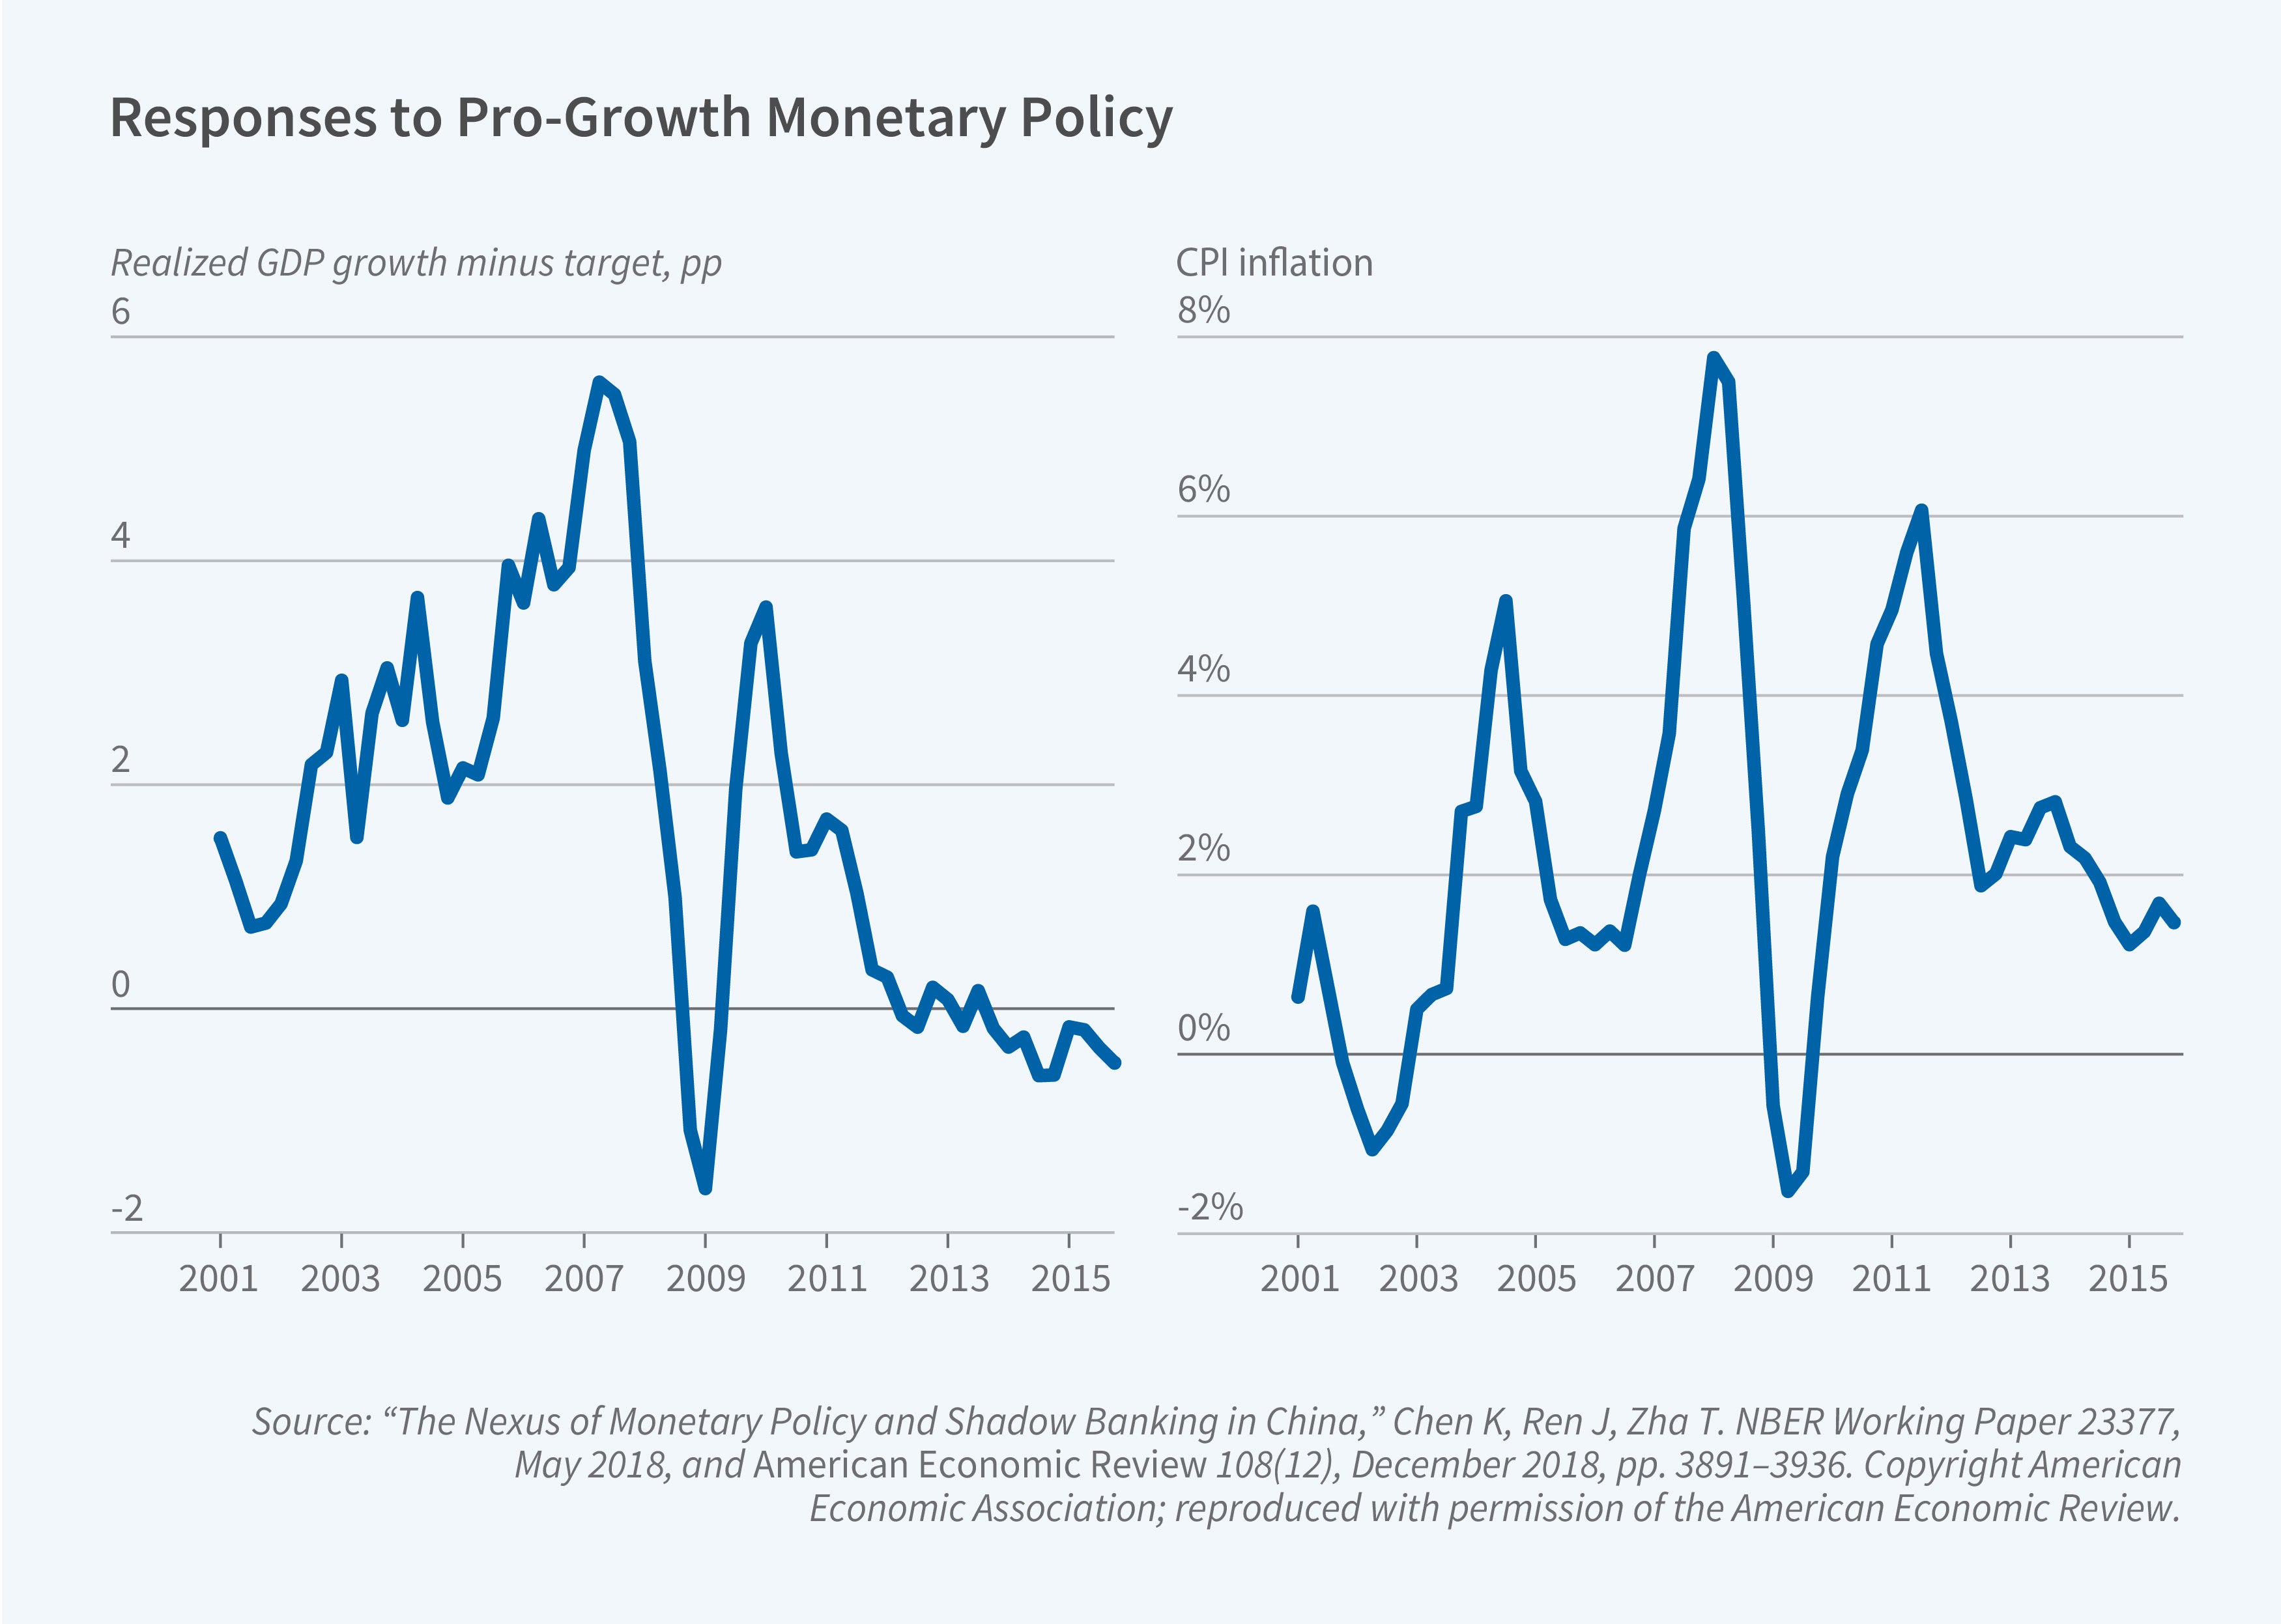
To support this preferential credit policy, the Chinese government pursued quantity-based monetary policy. From 1998 to 2017, under the supervision of the State Council, the People’s Bank of China (PBC) used a target of M2 supply growth rates as a primary tool to influence economic activity. This period is characterized by so-called pro-growth monetary policy [See Figure 3].3 As highlighted by former PBC governor Xiaochuan Zhou, China’s monetary policy “is yet to be understood by the outside world.” By incorporating key institutional characteristics, my collaborators and I formulate and estimate a quantity-based Taylor rule that accurately captures China’s monetary policy practices.

From 2000 to 2016, the PBC primarily used M2 growth to support output growth, manage inflation, and indirectly control aggregate bank loans. Our estimated monetary policy rule displays an asymmetric response to economic conditions. When GDP growth falls short of the government’s target, monetary policy becomes more aggressive and contributes twice as much to GDP fluctuations as in normal times. As shown in Figure 1, most M2 growth was driven by the endogenous response of monetary policy to the state of the economy. This pro-growth policy was transmitted to the economy by increased investment in heavy sectors financed by medium- and long-term bank credit preferentially allocated to large and capital-intensive firms.
This investment-driven growth strategy was exemplified by the 2009 economic stimulus, which combined expansionary fiscal and monetary policies. We develop a two-stage empirical model using granular loan-level data and find that this combined approach was particularly effective in stimulating GDP growth by increasing investment in the infrastructure sector in the wake of the 2008 global financial crisis.4 While the substantial boost in infrastructure spending successfully propelled GDP growth, it came at a cost: a reduction in available funds for private firms outside the infrastructure sector.
The crowding-out effects resulting from the infrastructure investment spree underscore the complex trade-offs associated with expansive fiscal measures that target specific sectors. The unintended consequence of reduced loanable funds for private investment exposed the double-edged sword of investment-driven policies. The post-2008 shift toward prioritizing SOEs, coupled with already elevated aggregate investment levels relative to GDP, raises questions about the sustainability of this growth model. The increasing dominance of SOEs and the resulting crowding-out of bank loans to and investment in POEs pose challenges to maintaining the previous pace of economic expansion.
Boom and Bust in Real Estate
Understanding the boom and bust of China’s real estate sector requires a closer look at China’s banking system. Using hand-collected transaction-level data on both shadow banking and balance-sheet activities, Chen, Ren, and I investigate why monetary tightening in China was ineffective in constraining bank credit to the real estate sector.5
As inflation in China began to rise after 2009, surging to 6 percent in 2011, the PBC tightened monetary policy. As expected, the traditional bank sector responded by decreasing lending. At the same time, however, this tightening spurred a rapid expansion of shadow banking from 2009 to 2015. The burgeoning activities of shadow banks effectively thwarted the PBC’s efforts to control credit growth and thus undermined the intended impact of monetary policy. Nonstate banks, driven by the search for higher yields in a tighter credit environment, actively engaged in shadow banking activities such as loaning funds to risky projects. The boom of shadow banking fueled a surge in loans for real estate investment. But shadow banking products were often moved onto banks’ balance sheets, ultimately elevating systemic risks to financial stability. The recent collapse of the China Evergrande Group, the second-largest property developer in China, is related to these lending practices.
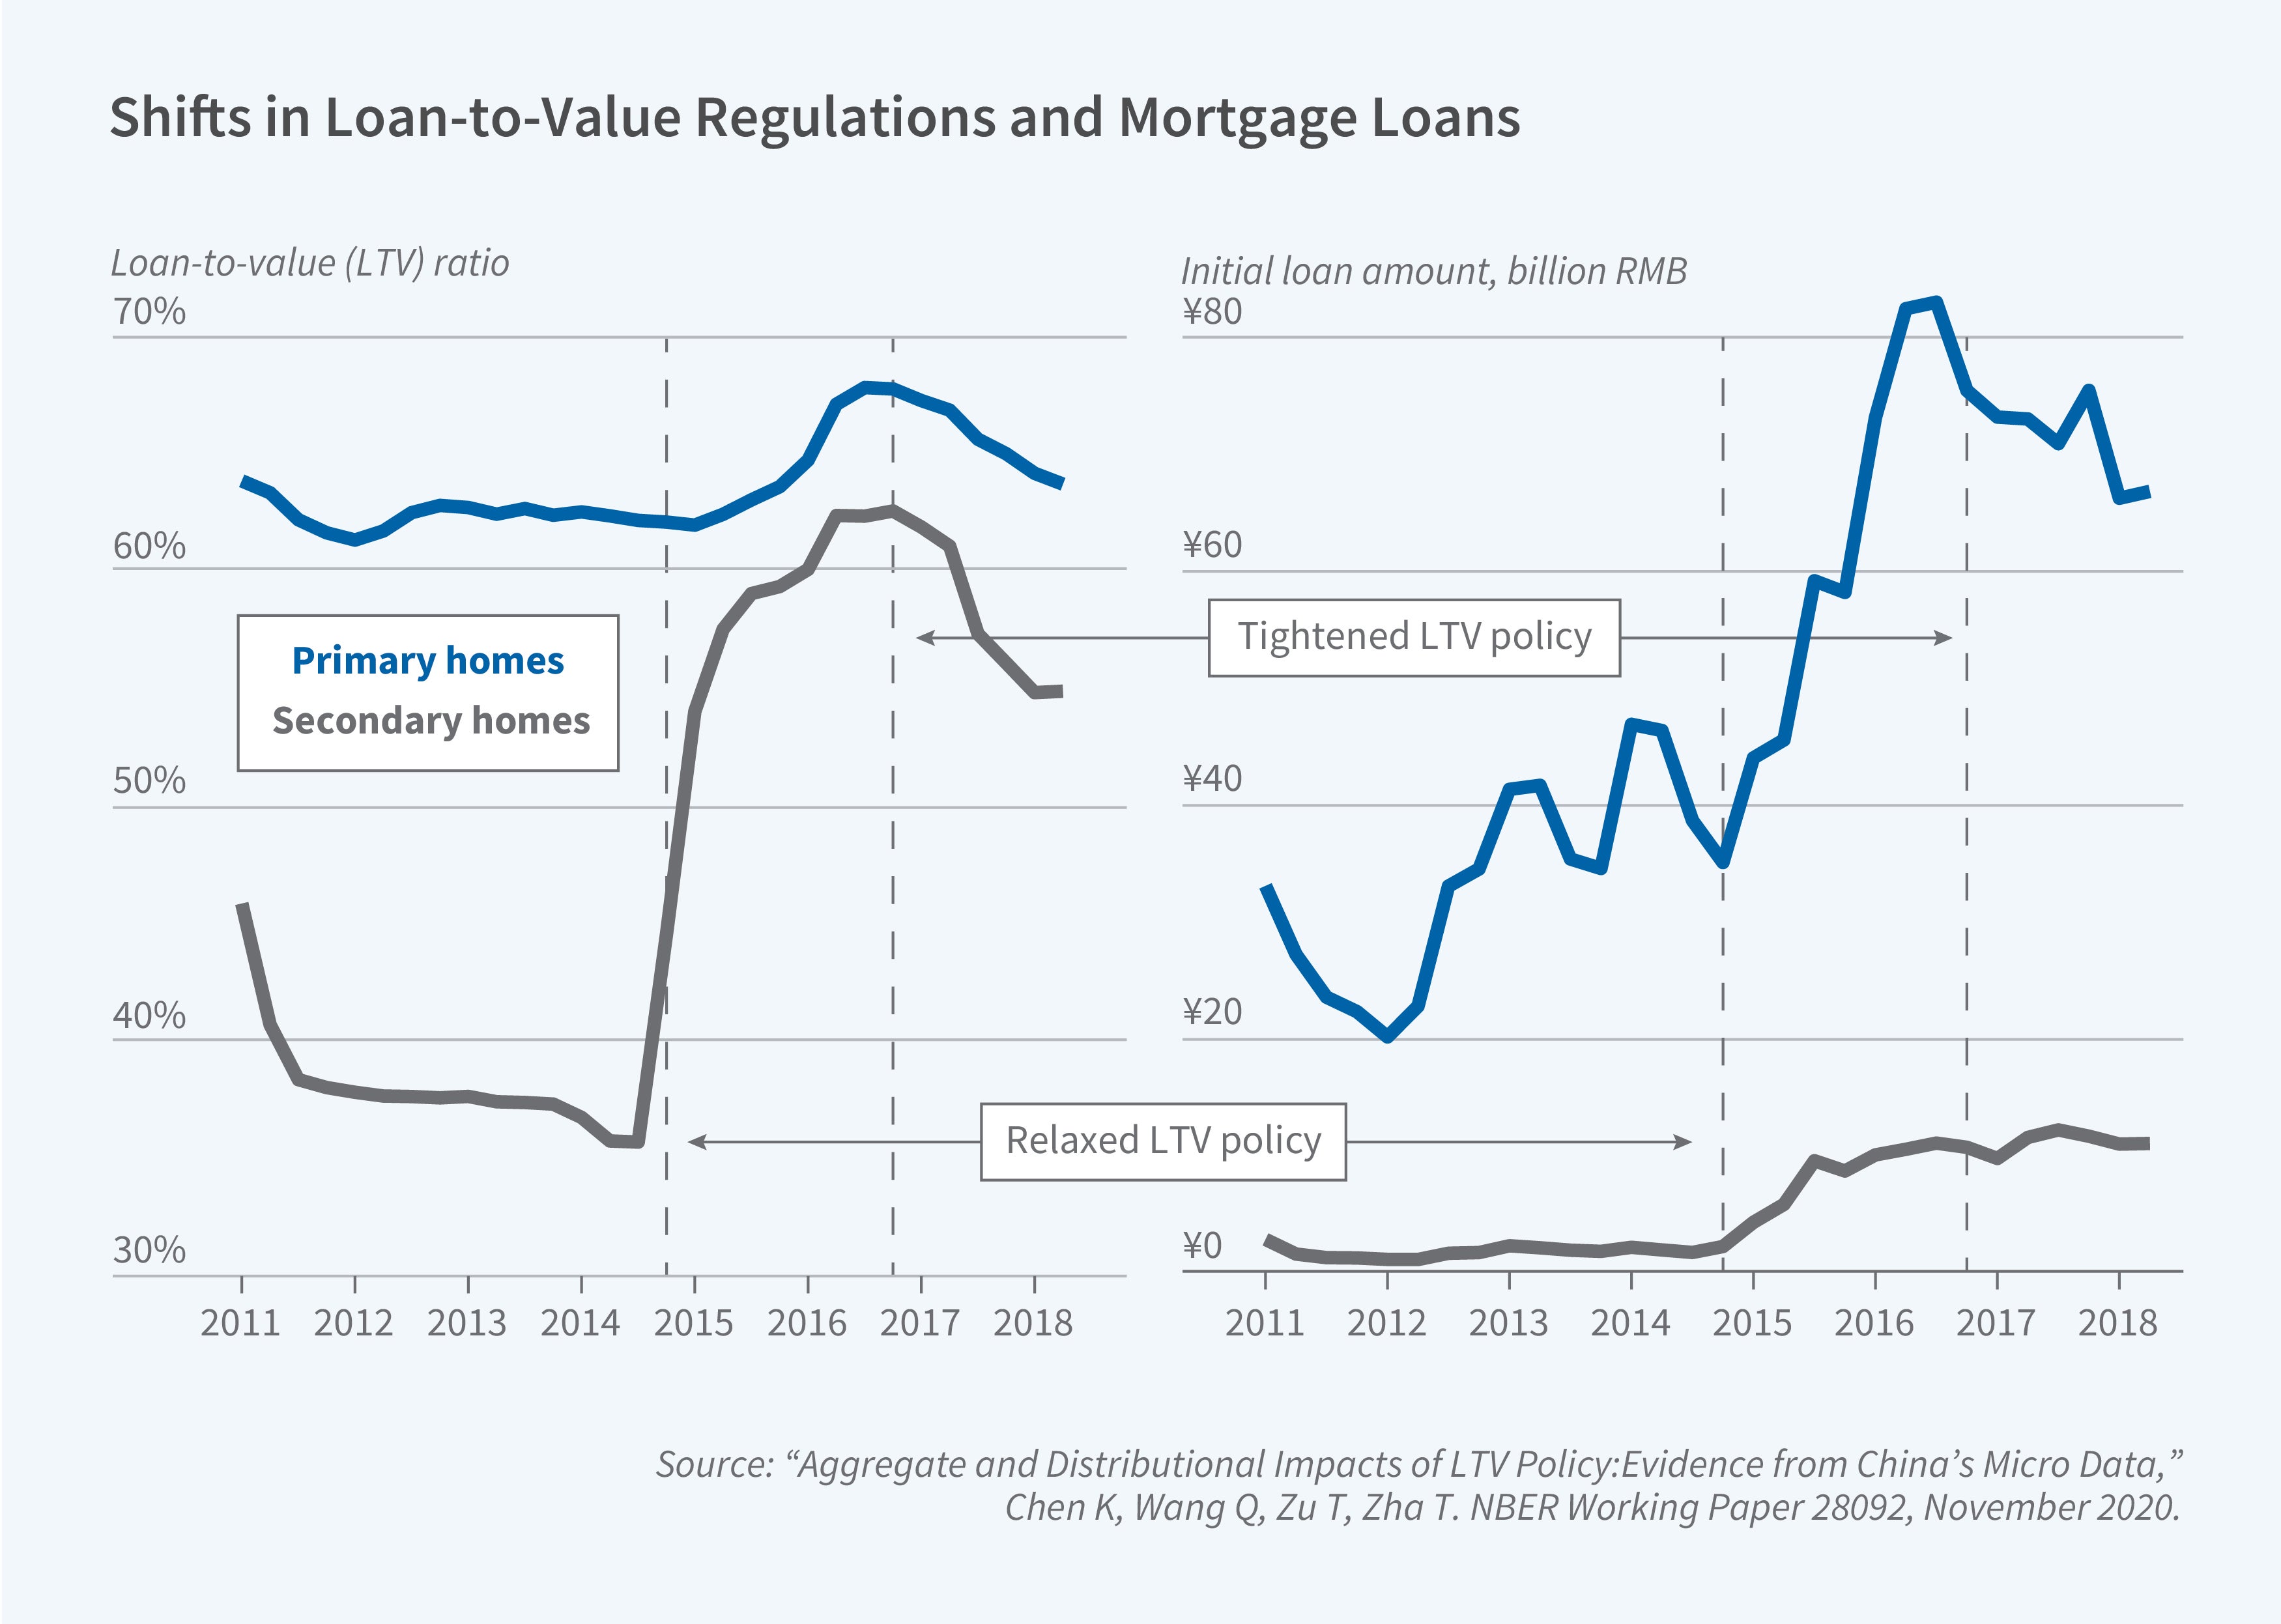
The surge of shadow banking activities in China had far-reaching consequences, leading to an overstock in the real estate sector, overcapacity in industries supporting real estate, and overleveraging in both the real and financial sectors. In response to these challenges, in late 2014, China made an unprecedented policy shift by relaxing the loan-to-value (LTV) ratio limit for secondary houses primarily used as investments. This policy experiment, unparalleled in magnitude both within China and globally, aimed to address the real estate overstock and stimulate housing market activity.
Using a comprehensive dataset of more than 3 million mortgage originations nationwide, we examine the impact of this policy change on the housing market from 2014Q4 to 2016Q3.6 Our findings highlight the pivotal role of the housing investment channel in magnifying the effects of a mortgage LTV policy change. As house prices surged, homeowners cashed in capital gains to upgrade to larger primary homes, setting off a positive feedback loop between rising house prices and increased mortgage demand. This feedback loop led to substantial increases in both equilibrium house prices and mortgage borrowing, demonstrating that the LTV policy change not only spurred investment in secondary houses but also boosted demand for primary homes.

We built and calibrated a life-cycle model that replicates these empirical findings. The model also reveals the distributional implications of the LTV policy across age-income groups by demonstrating how the policy generates the boom and bust of house prices and mortgage demand. Middle-aged households with high incomes or education benefit the most from capital gains due to rising house prices, and trade up their primary homes for speculative investment purposes. Young households are disadvantaged as they cannot afford to purchase their first homes due to rising prices. These distributional effects highlight the unintended trade-offs generated by housing policy changes.
After 2016, following the peak of the housing boom, China made a strategic decision to reverse the loosening of the LTV policy on secondary houses in an attempt to cool the overheated housing market. As a result, mortgage activity declined and in early 2024 house prices slumped, as did new property sales and property investment. This downturn in the real estate sector, a pillar of China’s macroeconomy, marked a significant departure from previous trends and underscored the challenges of managing housing market dynamics in a rapidly evolving macroeconomic environment. Our quantitative model predicts that, despite the temporary relaxation of the LTV policy, it still has a persistent negative effect on household consumption. During a housing boom, households delay consumption and investment in real estate, and then face the burden of mortgage debt long after the boom subsides. This prediction is consistent with the observed sluggishness of household consumption in China in recent years.
Sluggish Household Consumption
With investment growth reaching a plateau and the real estate sector facing a downturn, household consumption has emerged as a potentially critical engine for the Chinese economy. This perspective was explicitly emphasized during the Eighteenth National People’s Congress in 2012, which highlighted concerns about sluggish consumption growth and the disproportionately low share of income allocated to labor. My collaborators and I develop a conceptual framework for analyzing the potential for household consumption to spur growth. Our model predicts that China’s investment-driven growth model would inherently result in subdued consumption and a decline in labor’s share of national income.7
Our empirical evidence from the 2011–17 China Household Finance Surveys, as well as our life-cycle model, offers a similar prediction. While the mortgage boom generated wealth for middle-aged, highly educated households through capital gains from rising house prices, it also came at a significant cost. These households often curtailed consumption to finance their real estate investments, and the growing burden of mortgage debt relative to income further suppressed their spending. Consequently, despite creating wealth for a specific segment of the population, the mortgage boom ultimately contributed to a decline in overall household consumption.
Our research also highlights the significant impact of the COVID-19 pandemic on household consumption both during and after the pandemic. We construct China’s key macroeconomic variables to examine the macroeconomic fluctuations during the global financial crisis and the pandemic.8 Our analysis focuses on the differing impacts of these two crises on China’s economy, with a particular emphasis on the impacts on household consumption. We identify several distinct regimes in China’s economic history: the investment-driven period before 2008, the outbreak of the financial crisis, the post-2008 economic stimulus era, and the COVID period.
We find that the financial crisis affected China’s GDP primarily through its negative effects on investment and exports. Household consumption remained relatively stable throughout this period but failed to show strong growth during or after the 2009 economic stimulus. This finding is consistent with the Chinese government’s 2012 initiative to bolster household consumption in an effort to sustain economic growth. The pandemic, however, fundamentally altered the nature of economic shocks affecting China. The pandemic period emerged as a pivotal moment, as large shocks resulting from periodic lockdowns, which we term “consumption-constrained shocks,” exerted prolonged and significant negative impacts on household consumption expenditure. These shocks had a more pronounced effect on household consumption than previous crises, and they raised concerns about long-term prospects for China’s nascent consumption-centered growth strategy.
Challenges to Sustainable Growth
The rapid accumulation of household debt, corporate debt, and government debt was a cause for concern due to potential risks to financial stability even before the pandemic hit. These risks were heightened by pandemic shocks. My collaborators’ and my research underscores the significant challenges China faces in transitioning to a more balanced and sustainable growth model in which household consumption plays a central role.
The views expressed herein do not necessarily reflect the views of the Federal Reserve Bank of Atlanta or the Federal Reserve System.


