Program Report: Environment and Energy Economics, 2023
Launched in 2007, the NBER’s Environment and Energy Economics (EEE) Program brings together scholars working on environmental, energy, and natural resource economics. The EEE Program now has 126 affiliated researchers, 53 of whom share an appointment in another NBER program. EEE researchers have produced 740 working papers since the last program report in June of 2016.
The EEE Program holds two regular annual meetings and several specialized meetings throughout the year. Recent specialized meetings have included workshops on the distributional impacts of climate change in the agricultural sector and of new energy policies, the economics of energy use in transportation, the economics of decarbonizing industrial production, and economic perspectives on water resources, climate change, and agricultural sustainability. Since 2019, the program has also hosted an annual conference in Washington, DC on “Environmental and Energy Policy and the Economy.”
Our group is diverse in terms of the empirical methods we use, the theoretical foundations we build on, and the topics we study. Some primarily focus on issues and questions in energy economics, such as the design of wholesale electricity markets or the economics of oil and gas extraction. Others focus on purely environmental economics topics, such as the economics of biodiversity protection or the long-run effects of air pollution. Given the critical role that energy markets will play in any meaningful response to climate change and environmental degradation, a growing number of affiliates are conducting research at the intersection of energy and environmental economics.
It is impossible to do justice to the breadth and depth of program affiliates’ research in this short report. The last program report highlighted work on climate change impacts and policy design, on local air pollution, and on energy use in the developing world. We will use this opportunity to highlight some other flourishing lines of inquiry. As an organizing framework, we could not resist the temptation to draw inspiration from the 1970s band Earth, Wind, and Fire.
Earth
The EEE Program has an abiding interest in the economic costs and benefits of activities that affect the earth. This includes studies of how market-based approaches can advance conservation objectives, as well as the economic consequences of resource destruction.
Environmental offsets are playing an increasingly central role in modern-day efforts to achieve environmental and conservation objectives more cost-effectively. For example, Daniel Aronoff and Will Rafey study offsets in the important context of wetlands conservation. In a recent working paper, they develop a structural model in which a regulator allows households and firms to generate offsets by investing in land restoration and selling those offsets to others who want to use land for real estate development.1 They apply the model to study a market for wetlands offsets in Florida.
Section 404 of the Clean Water Act created a “No Net Loss” mandate for existing wetlands. In Florida, developers can repurpose a wetland area for other uses, provided the development is accompanied by approved actions that offset the wetland degradation. The Florida system allows developers to buy those offsets from others. Aronoff and Rafey use observed offset trades, prices, and production to measure the private gains from trade and to predict wetlands reallocation and environmental outcomes under alternative market designs. In addition, they combine their model of supply and demand for offsets with a hydrological model that allows them to estimate the expected flood damages from shifting wetlands from one area to another. They find that trade substantially increases private welfare but also increases total flood damages. However, combining the offset market with a Pigouvian tax proportional to local flood risk can eliminate almost 90 percent of flood damages while preserving over two-thirds of the private benefits.
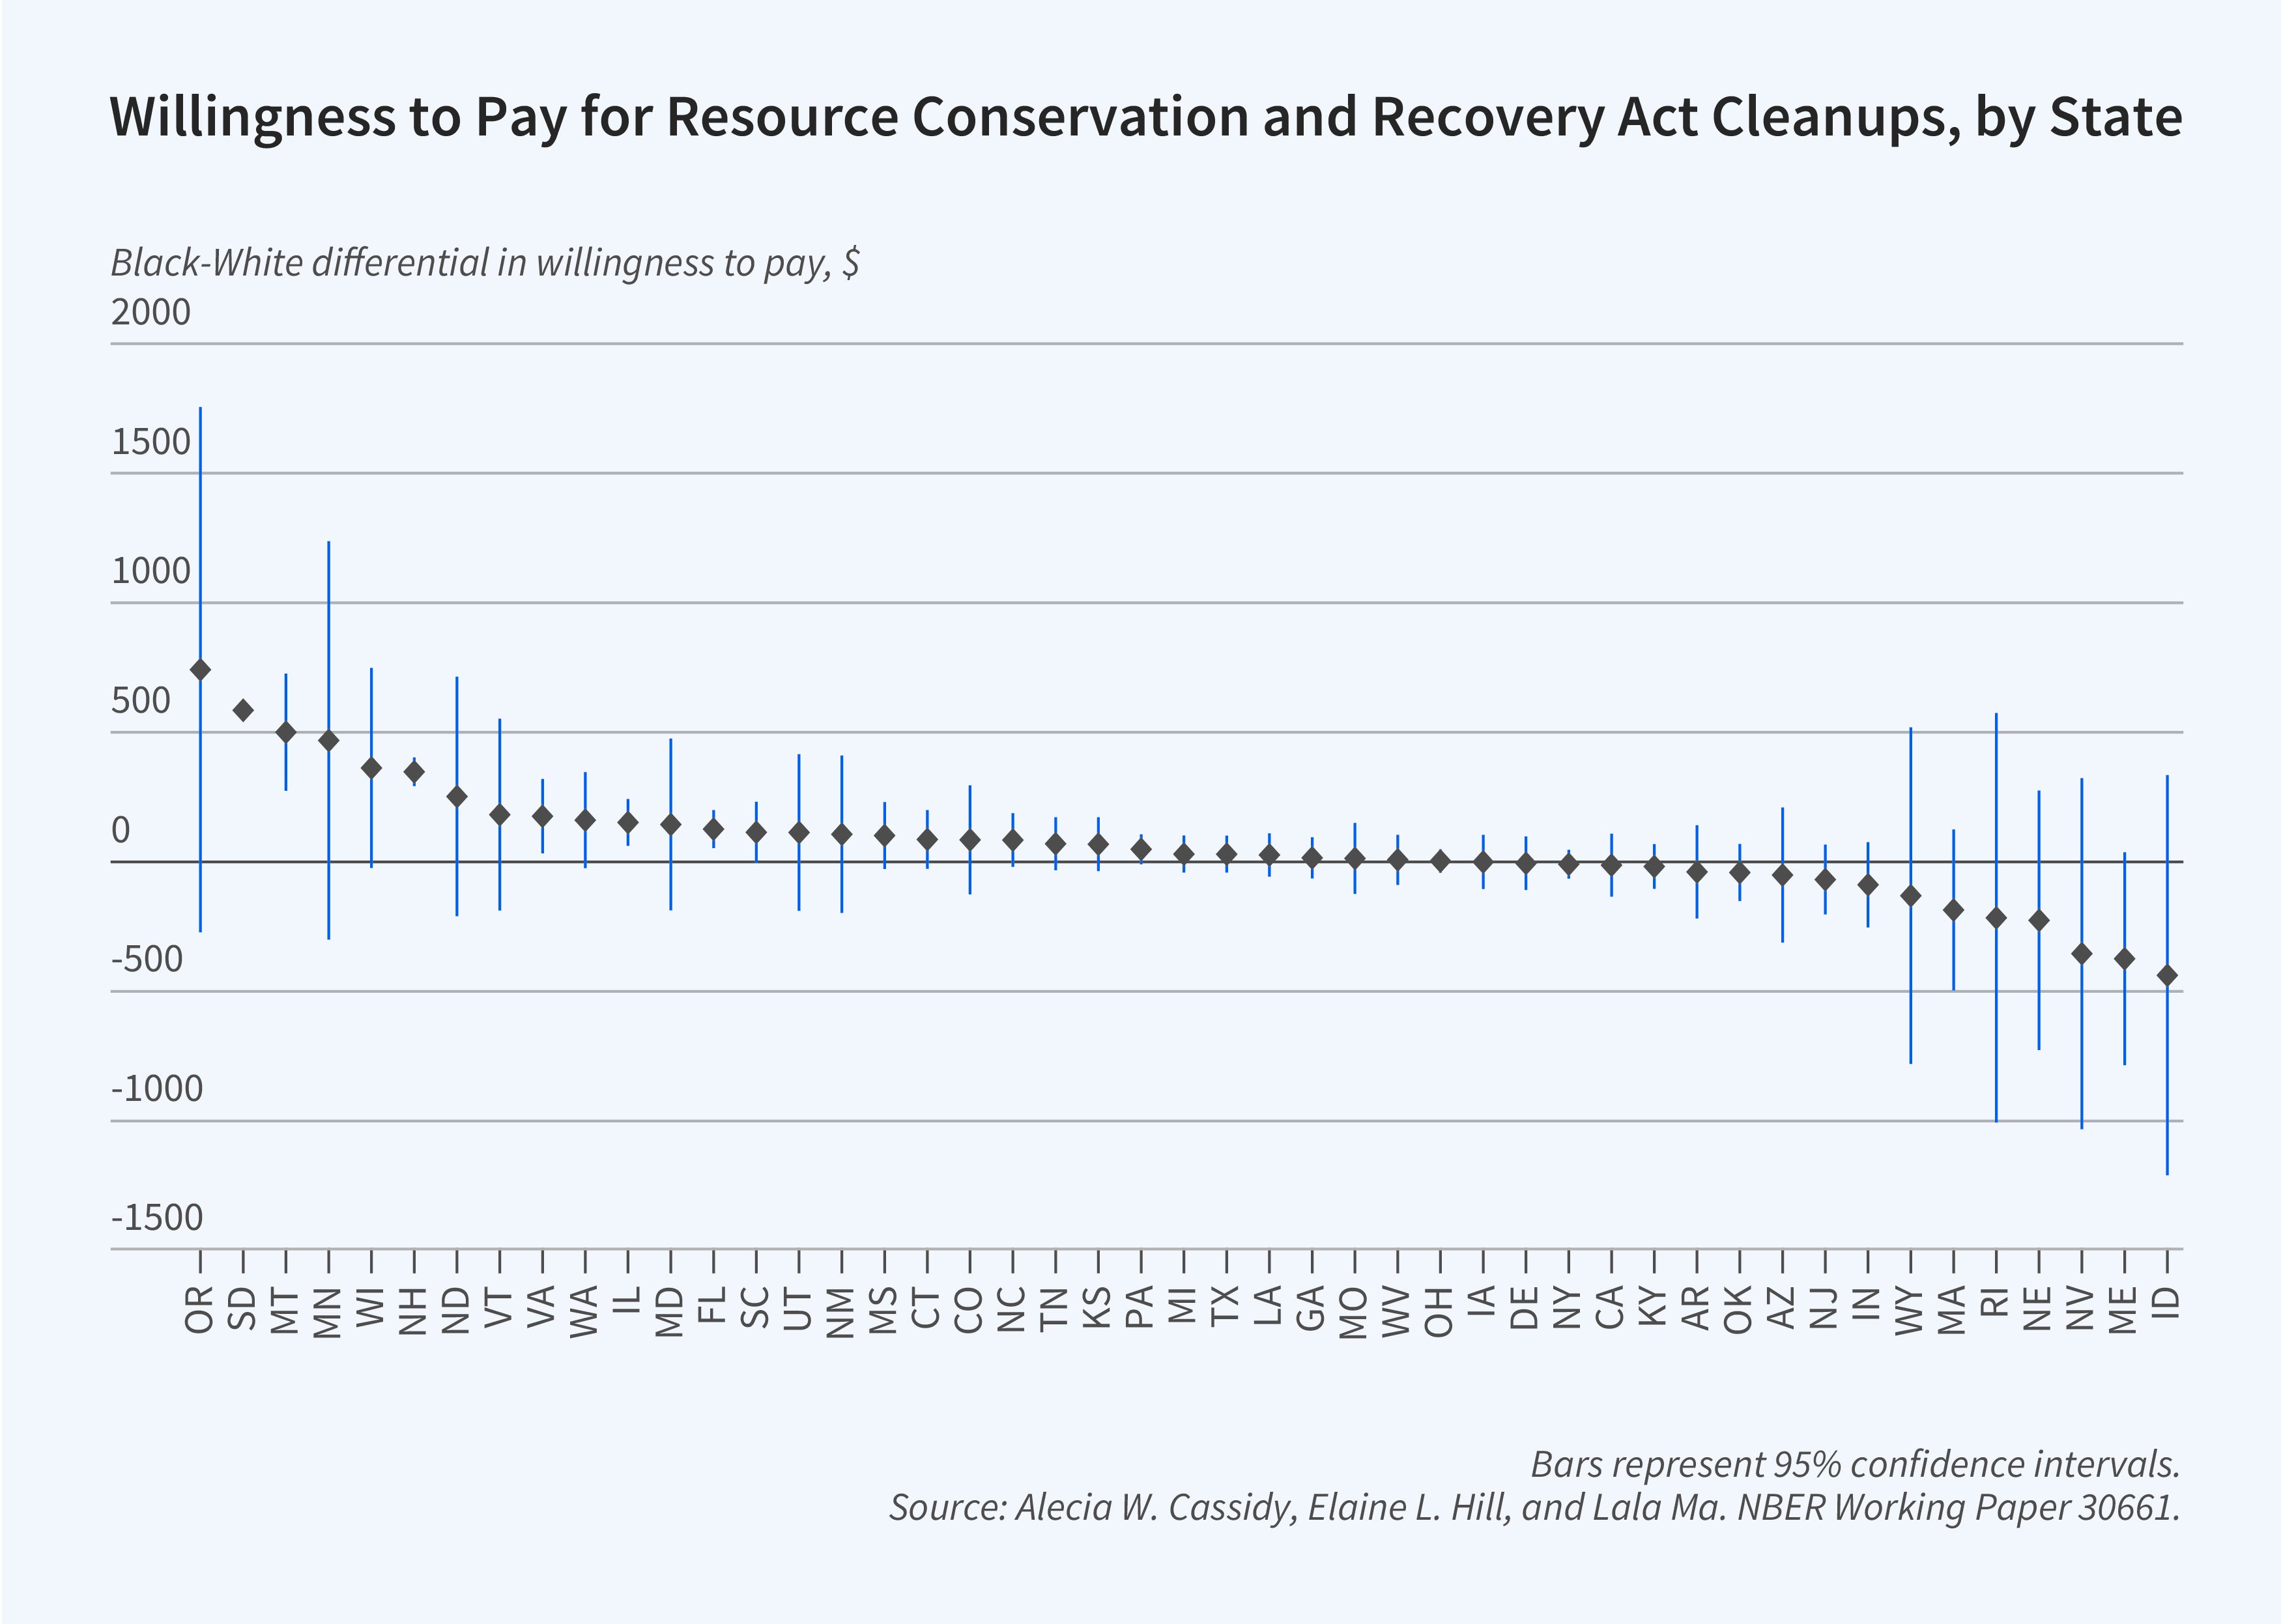
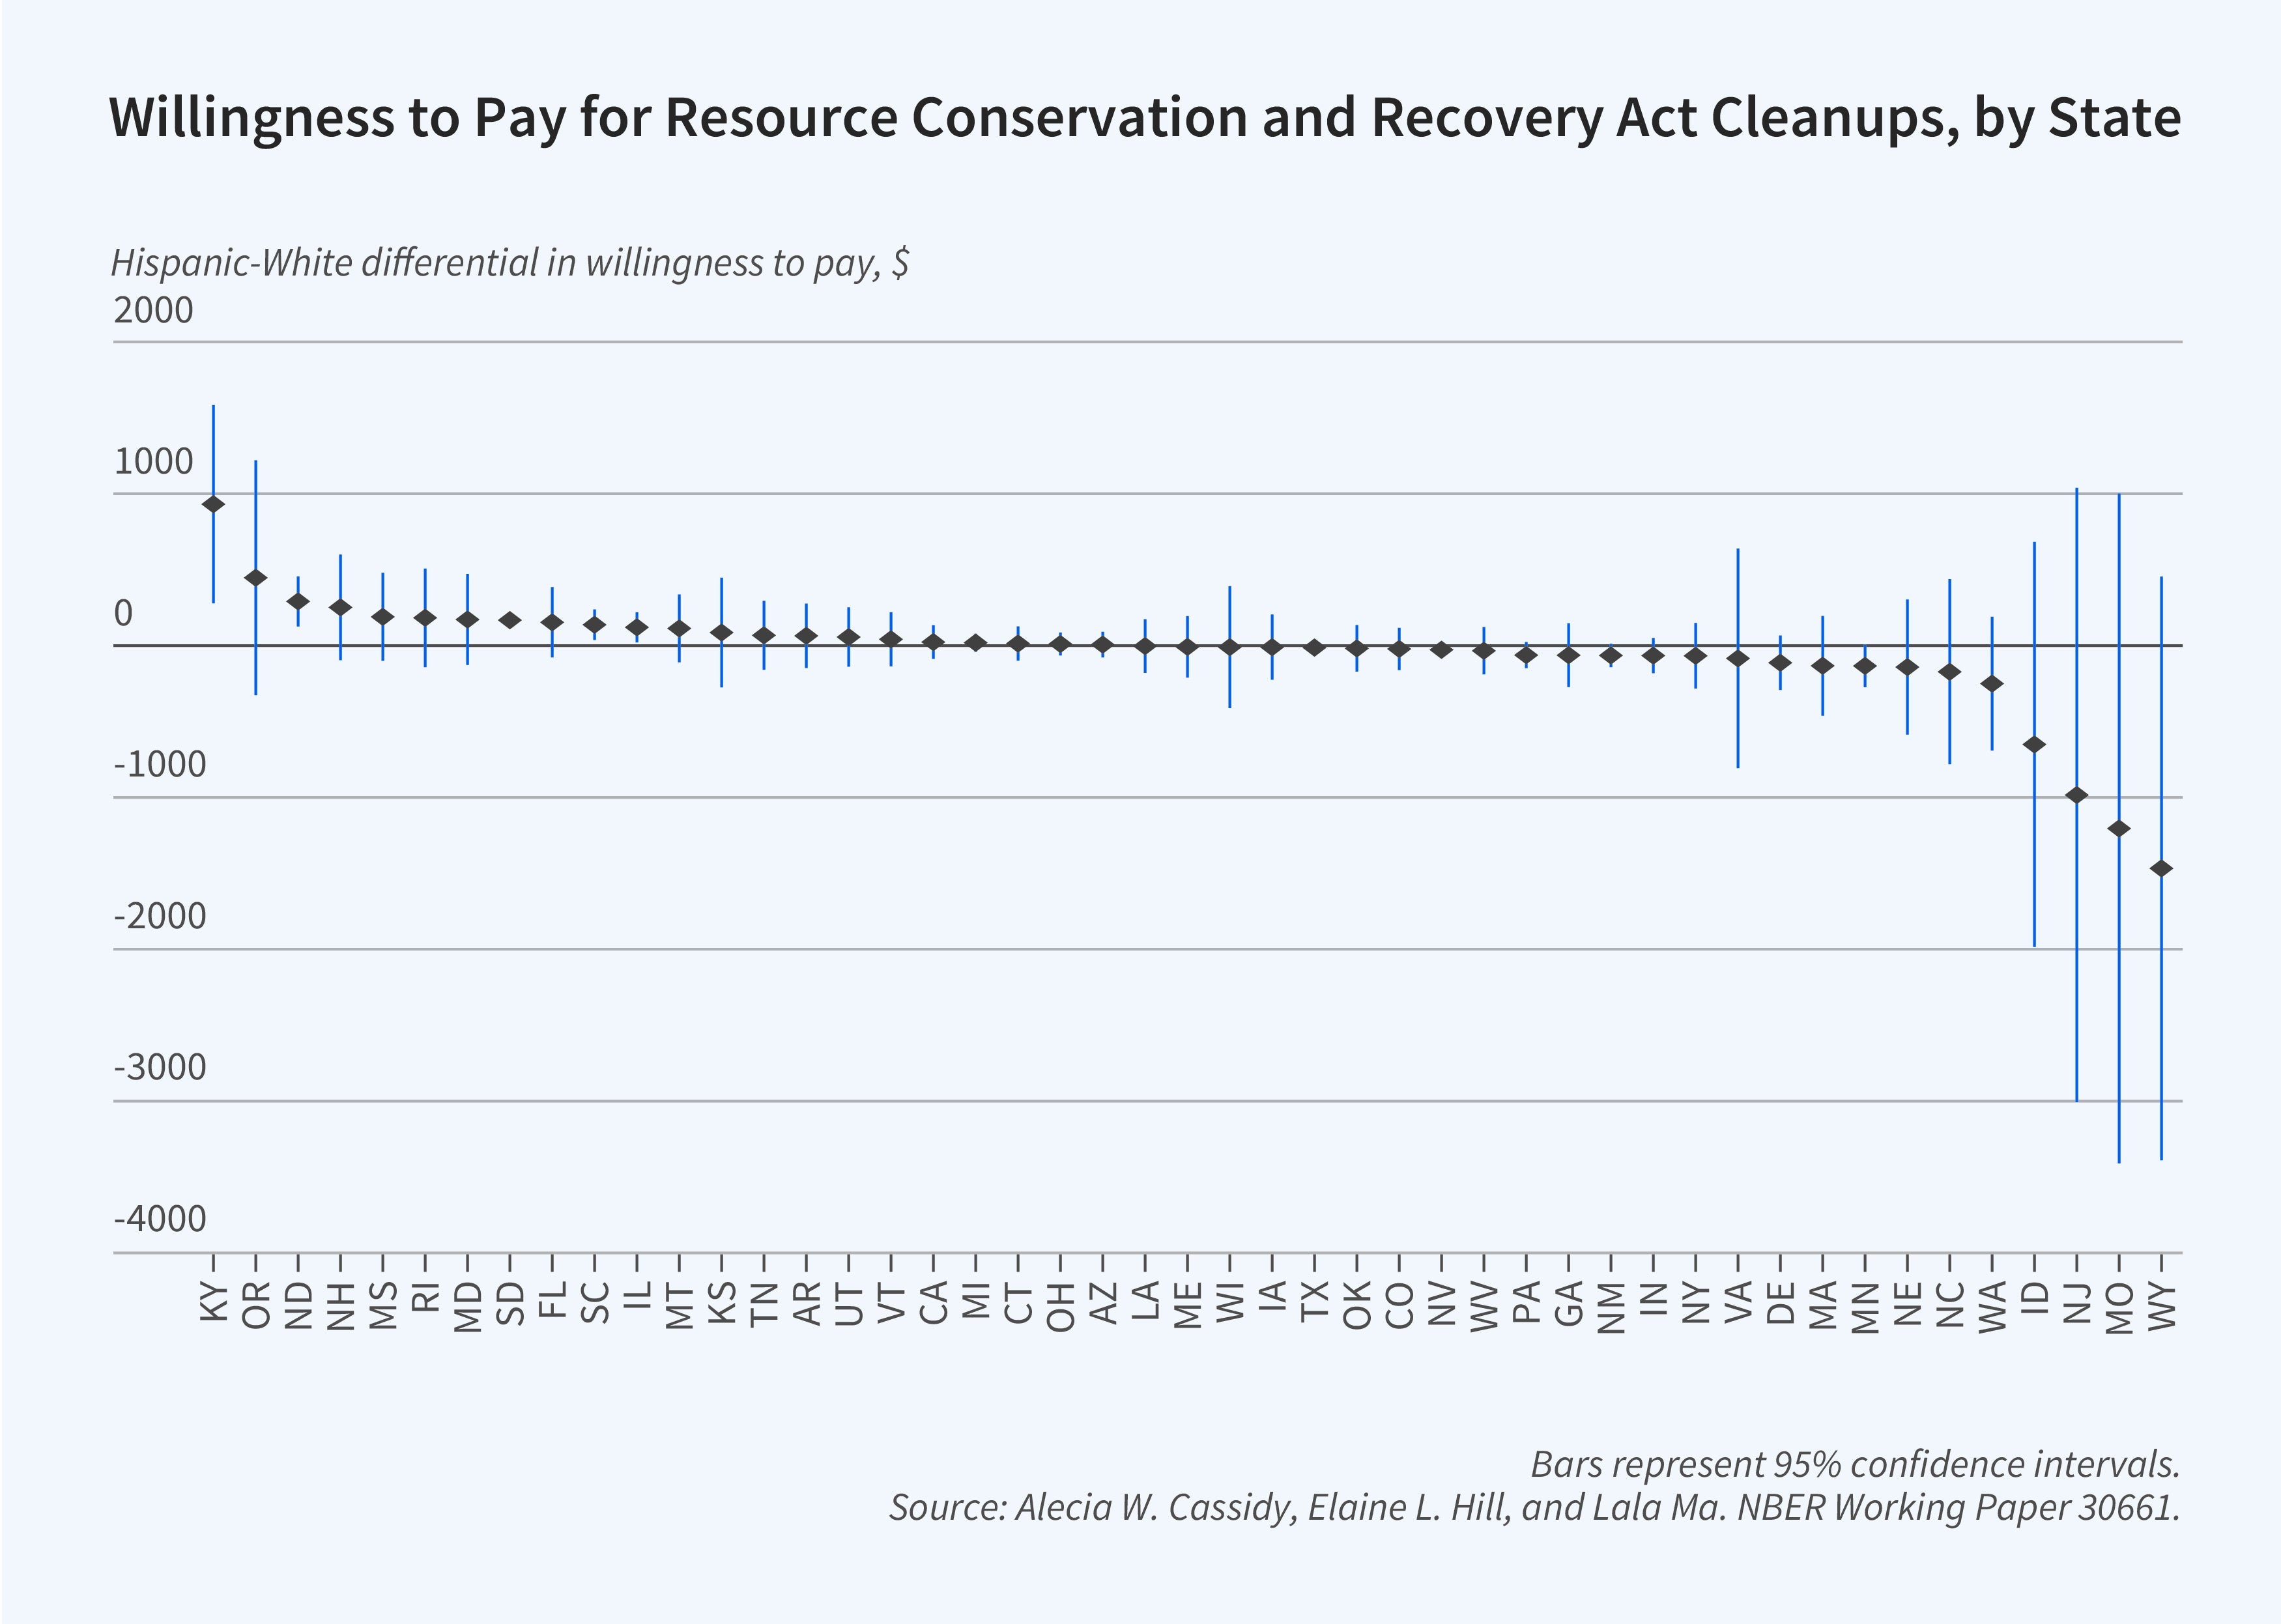
Land restoration also takes place after hazardous material leaks. Alecia Cassidy, Elaine Hill, and Lala Ma study the beneficiaries of hazardous waste cleanup.2 Specifically, they estimate the housing price benefits at the census tract level of the cleanups performed under the Resource Conservation and Recovery Act (RCRA) Corrective Action Program and how these housing price effects correlate with sociodemographic variables. They leverage spatial variation in the distance between facilities and census tract boundaries and variation in the timing of cleanups to identify housing market impacts. They find that house price benefits are highly localized, and they find little heterogeneity in willingness to pay for cleanups across race. They find only weak evidence of sorting across sociodemographic variables in response to cleanups. Figures 1 and 2 plot the differences in willingness to pay between Blacks and Whites, and Hispanics and Whites, across states. Taken together these results imply that the benefits from cleaning up hazardous waste under the RCRA accrue to those living closest to the facilities, who tend to be from relatively disadvantaged groups.
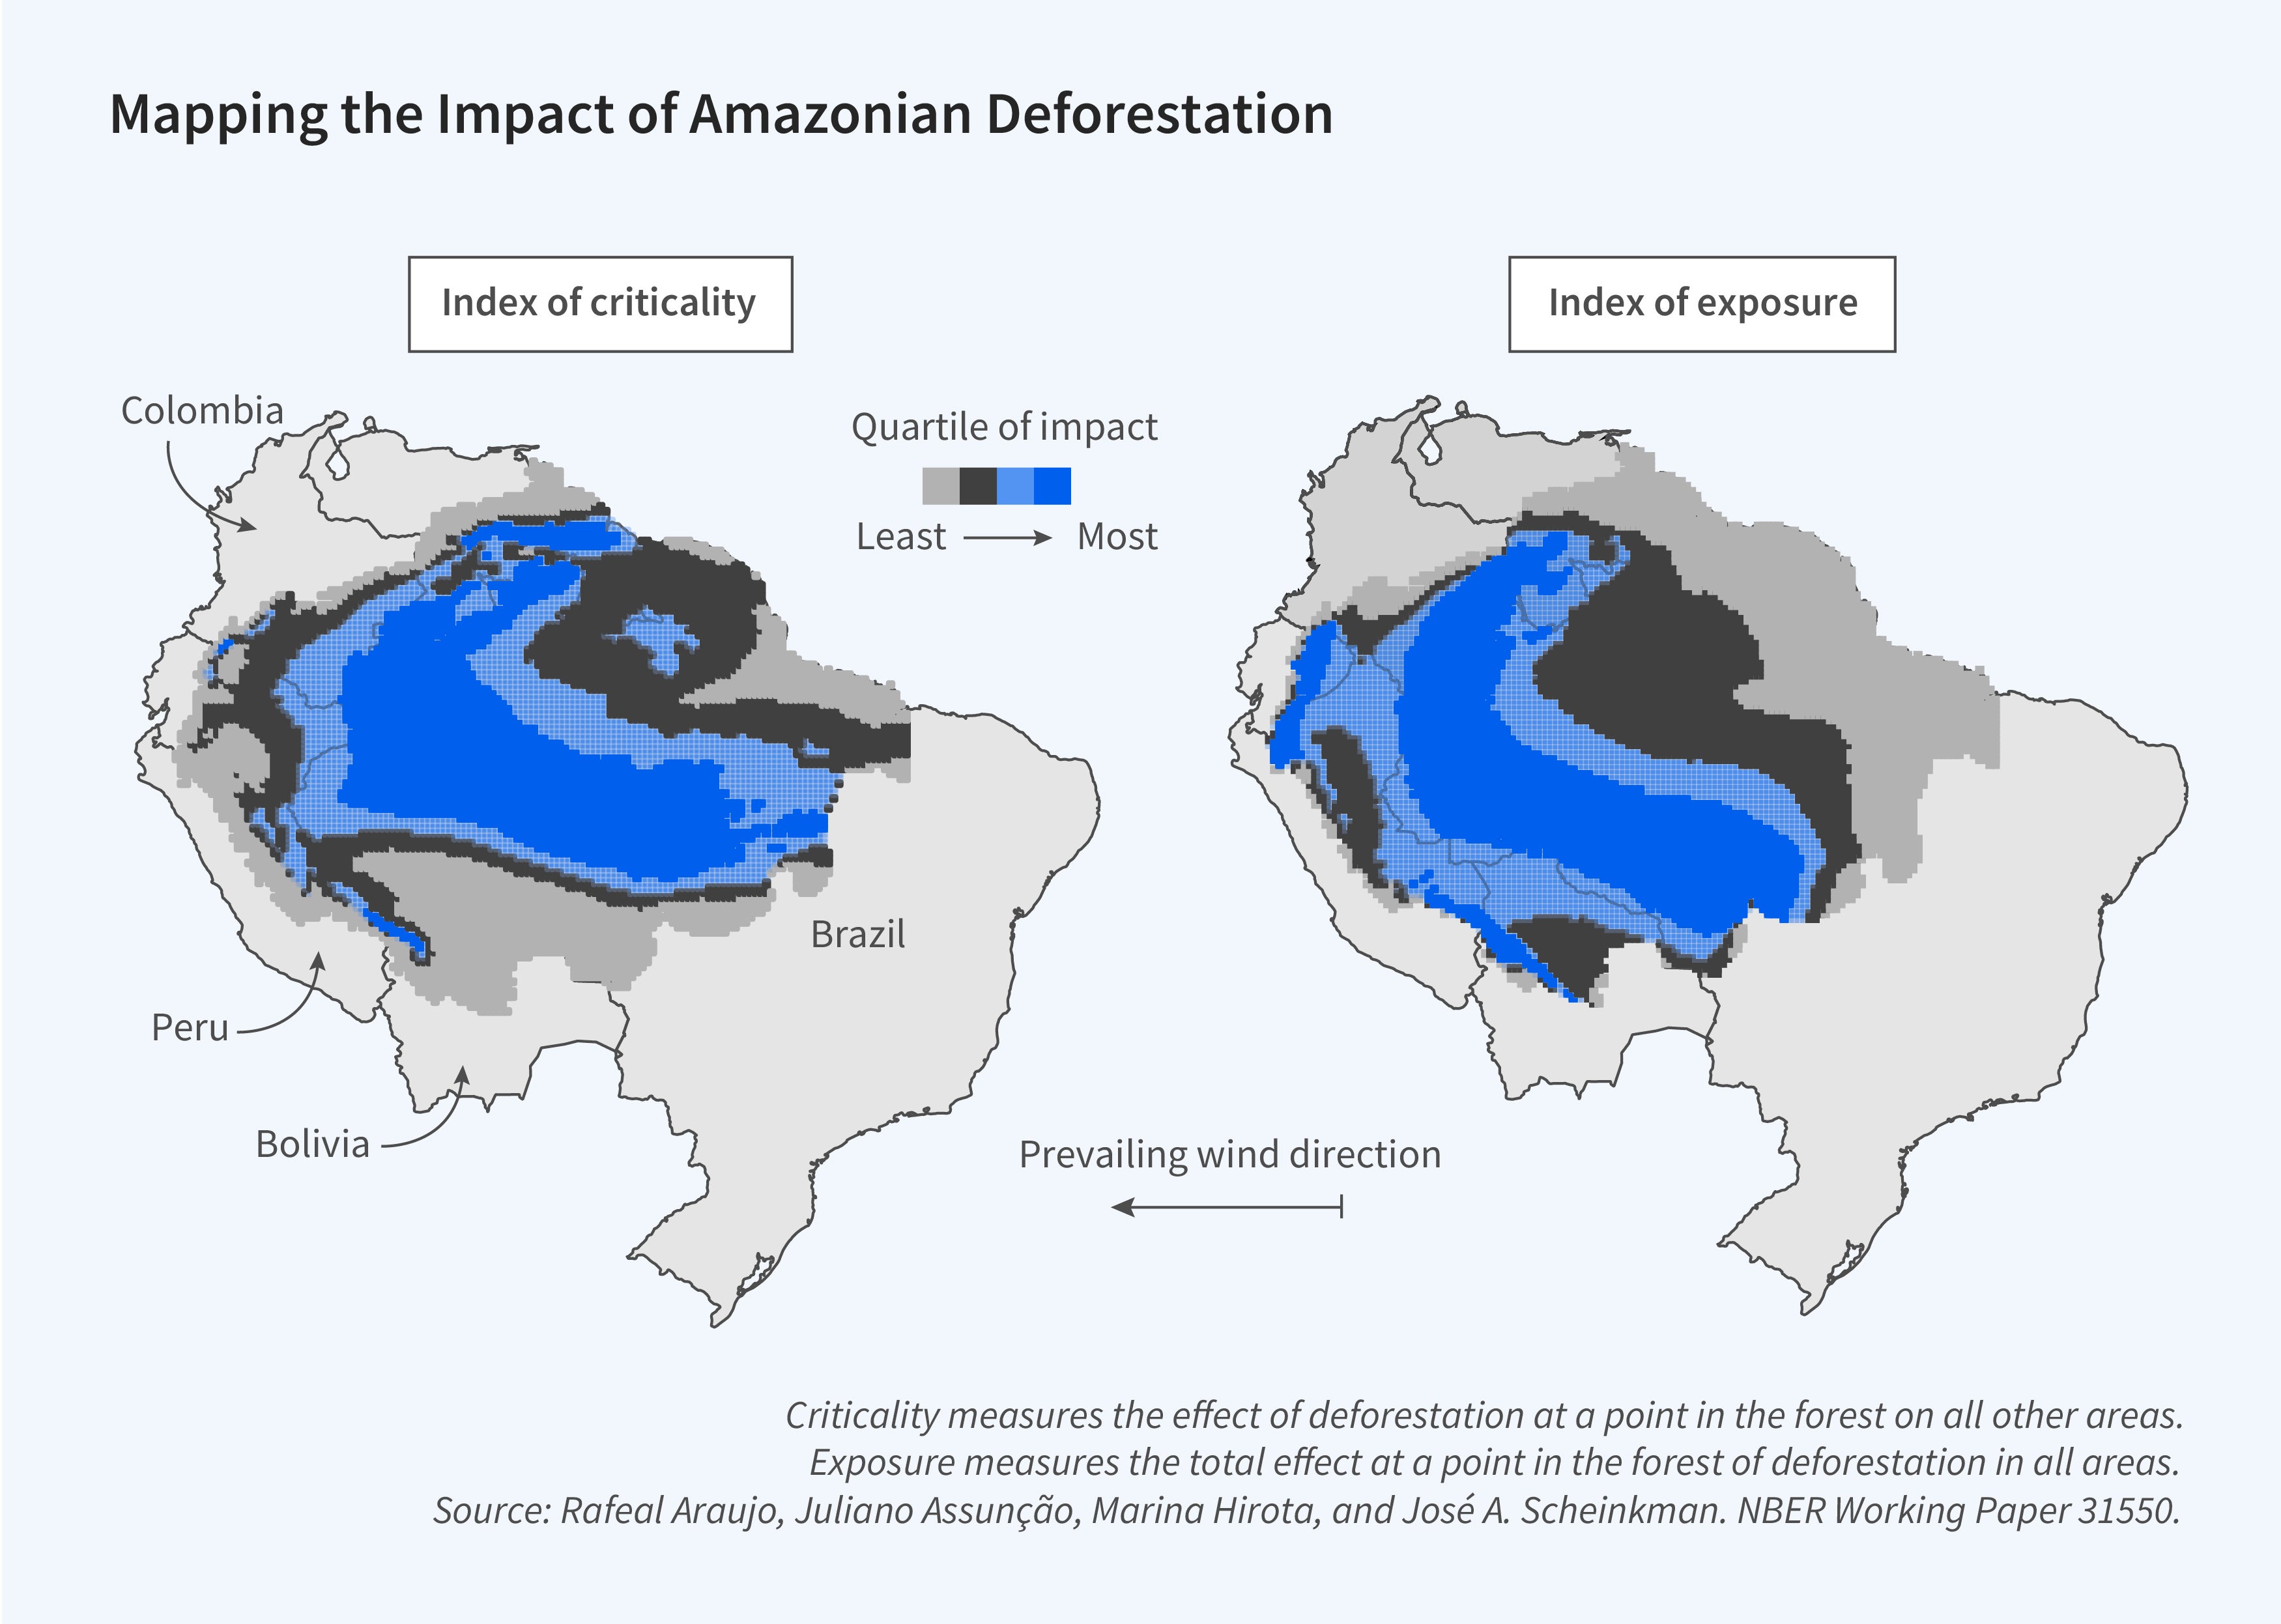
Forests play several crucial roles in the environment, including provision of natural habitats to support biodiversity, carbon sequestration, and water cycle maintenance. Rafael Araujo, Juliano Assunção, Marina Hirota, and José Scheinkman study the likelihood of local disturbances in the Amazon cascading to downwind locations due to the east-west atmospheric flow generated by trade winds.3 They estimate a model of spatial and temporal interactions that captures the cascading effects of local disturbances, such as deforestation of a local area or a localized drought. They generate a single matrix that maps where the damage of an initial forest disturbance is amplified and propagated. This matrix, in turn, identifies the regions likely to cause the largest impact throughout the basin and those most vulnerable to shocks caused by remote deforestation. They find that on average the presence of wind-mediated cascading effects doubles the impact of the initial damage. There is, however, substantial heterogeneity, which is shown in Figure 3.
Wind
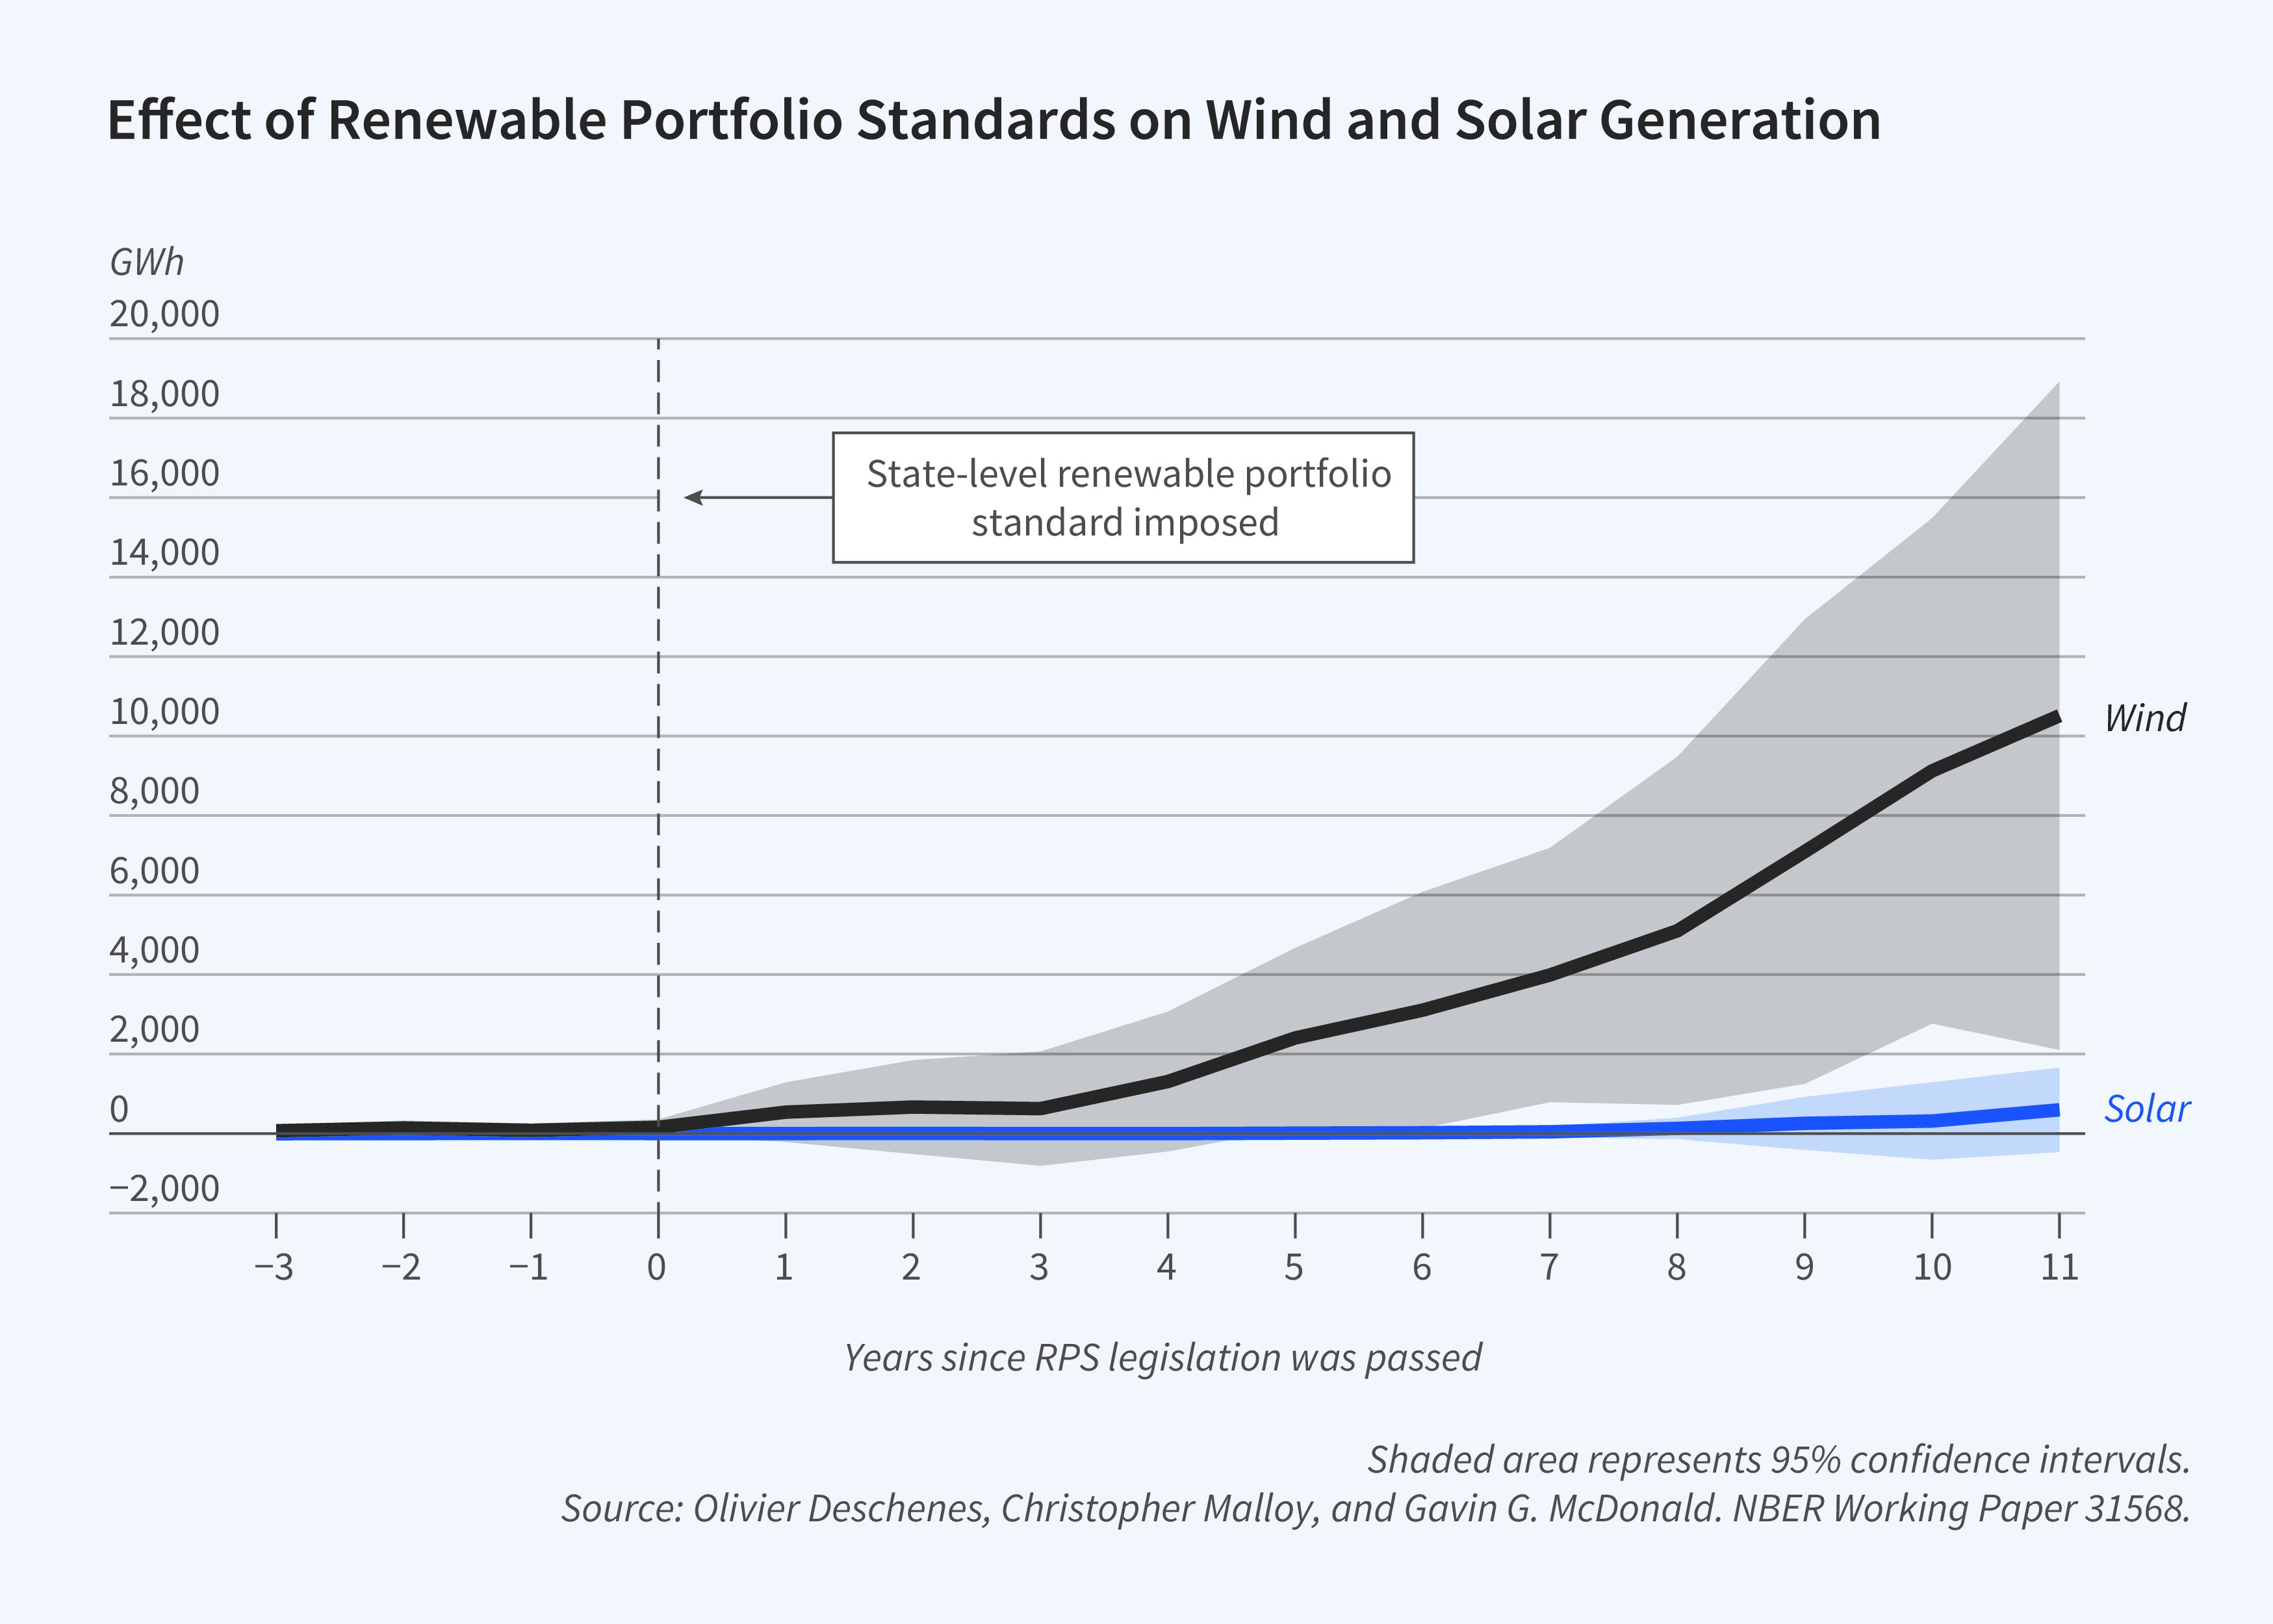
Because of both climate policy interventions and technological change, electricity markets throughout the world are decarbonizing. The bulk of the carbon-free investments have been in wind and solar. Research from the EEE group has been instrumental in analyzing the economics of the energy transition. One topic within this theme is the impact of policy on clean technology investment. Olivier Deschenes, Christopher Malloy, and Gavin McDonald provide causal estimates of how renewable portfolio standards (RPS) affect investment in and generation from wind and solar and the heterogeneity in these outcomes.4 They find that RPS increase wind capacity and generation; however, they do not find a statistically significant increase in solar capacity and generation, although with a lag. This is seen in Figure 4.
Stephen Holland, Erin Mansur, and Andrew Yates develop a long-run model of entry and exit of generation assets in electricity markets.5 They calibrate it for 13 regions of the US and analyze how different policies affect investment in wind, solar, and other carbon-free resources. They find that a carbon tax of $150 per ton essentially eliminates carbon emissions, and that the attractiveness of renewable subsidies compared to subsidies for nuclear generation varies depending on the decarbonization goal.
More recently, John Bistline, Neil Mehrotra, and Catherine Wolfram simulate the economic impacts of the Inflation Reduction Act (IRA).6 They predict that annual investment in low-carbon-emitting technologies will nearly double as a result of the IRA compared to a business-as-usual case, increasing the amount of decarbonization in the electricity sector by roughly 15 percentage points in 2040. They also find that the IRA provisions are cost-effective using the EPA’s proposed social cost of carbon of roughly $190 per ton.
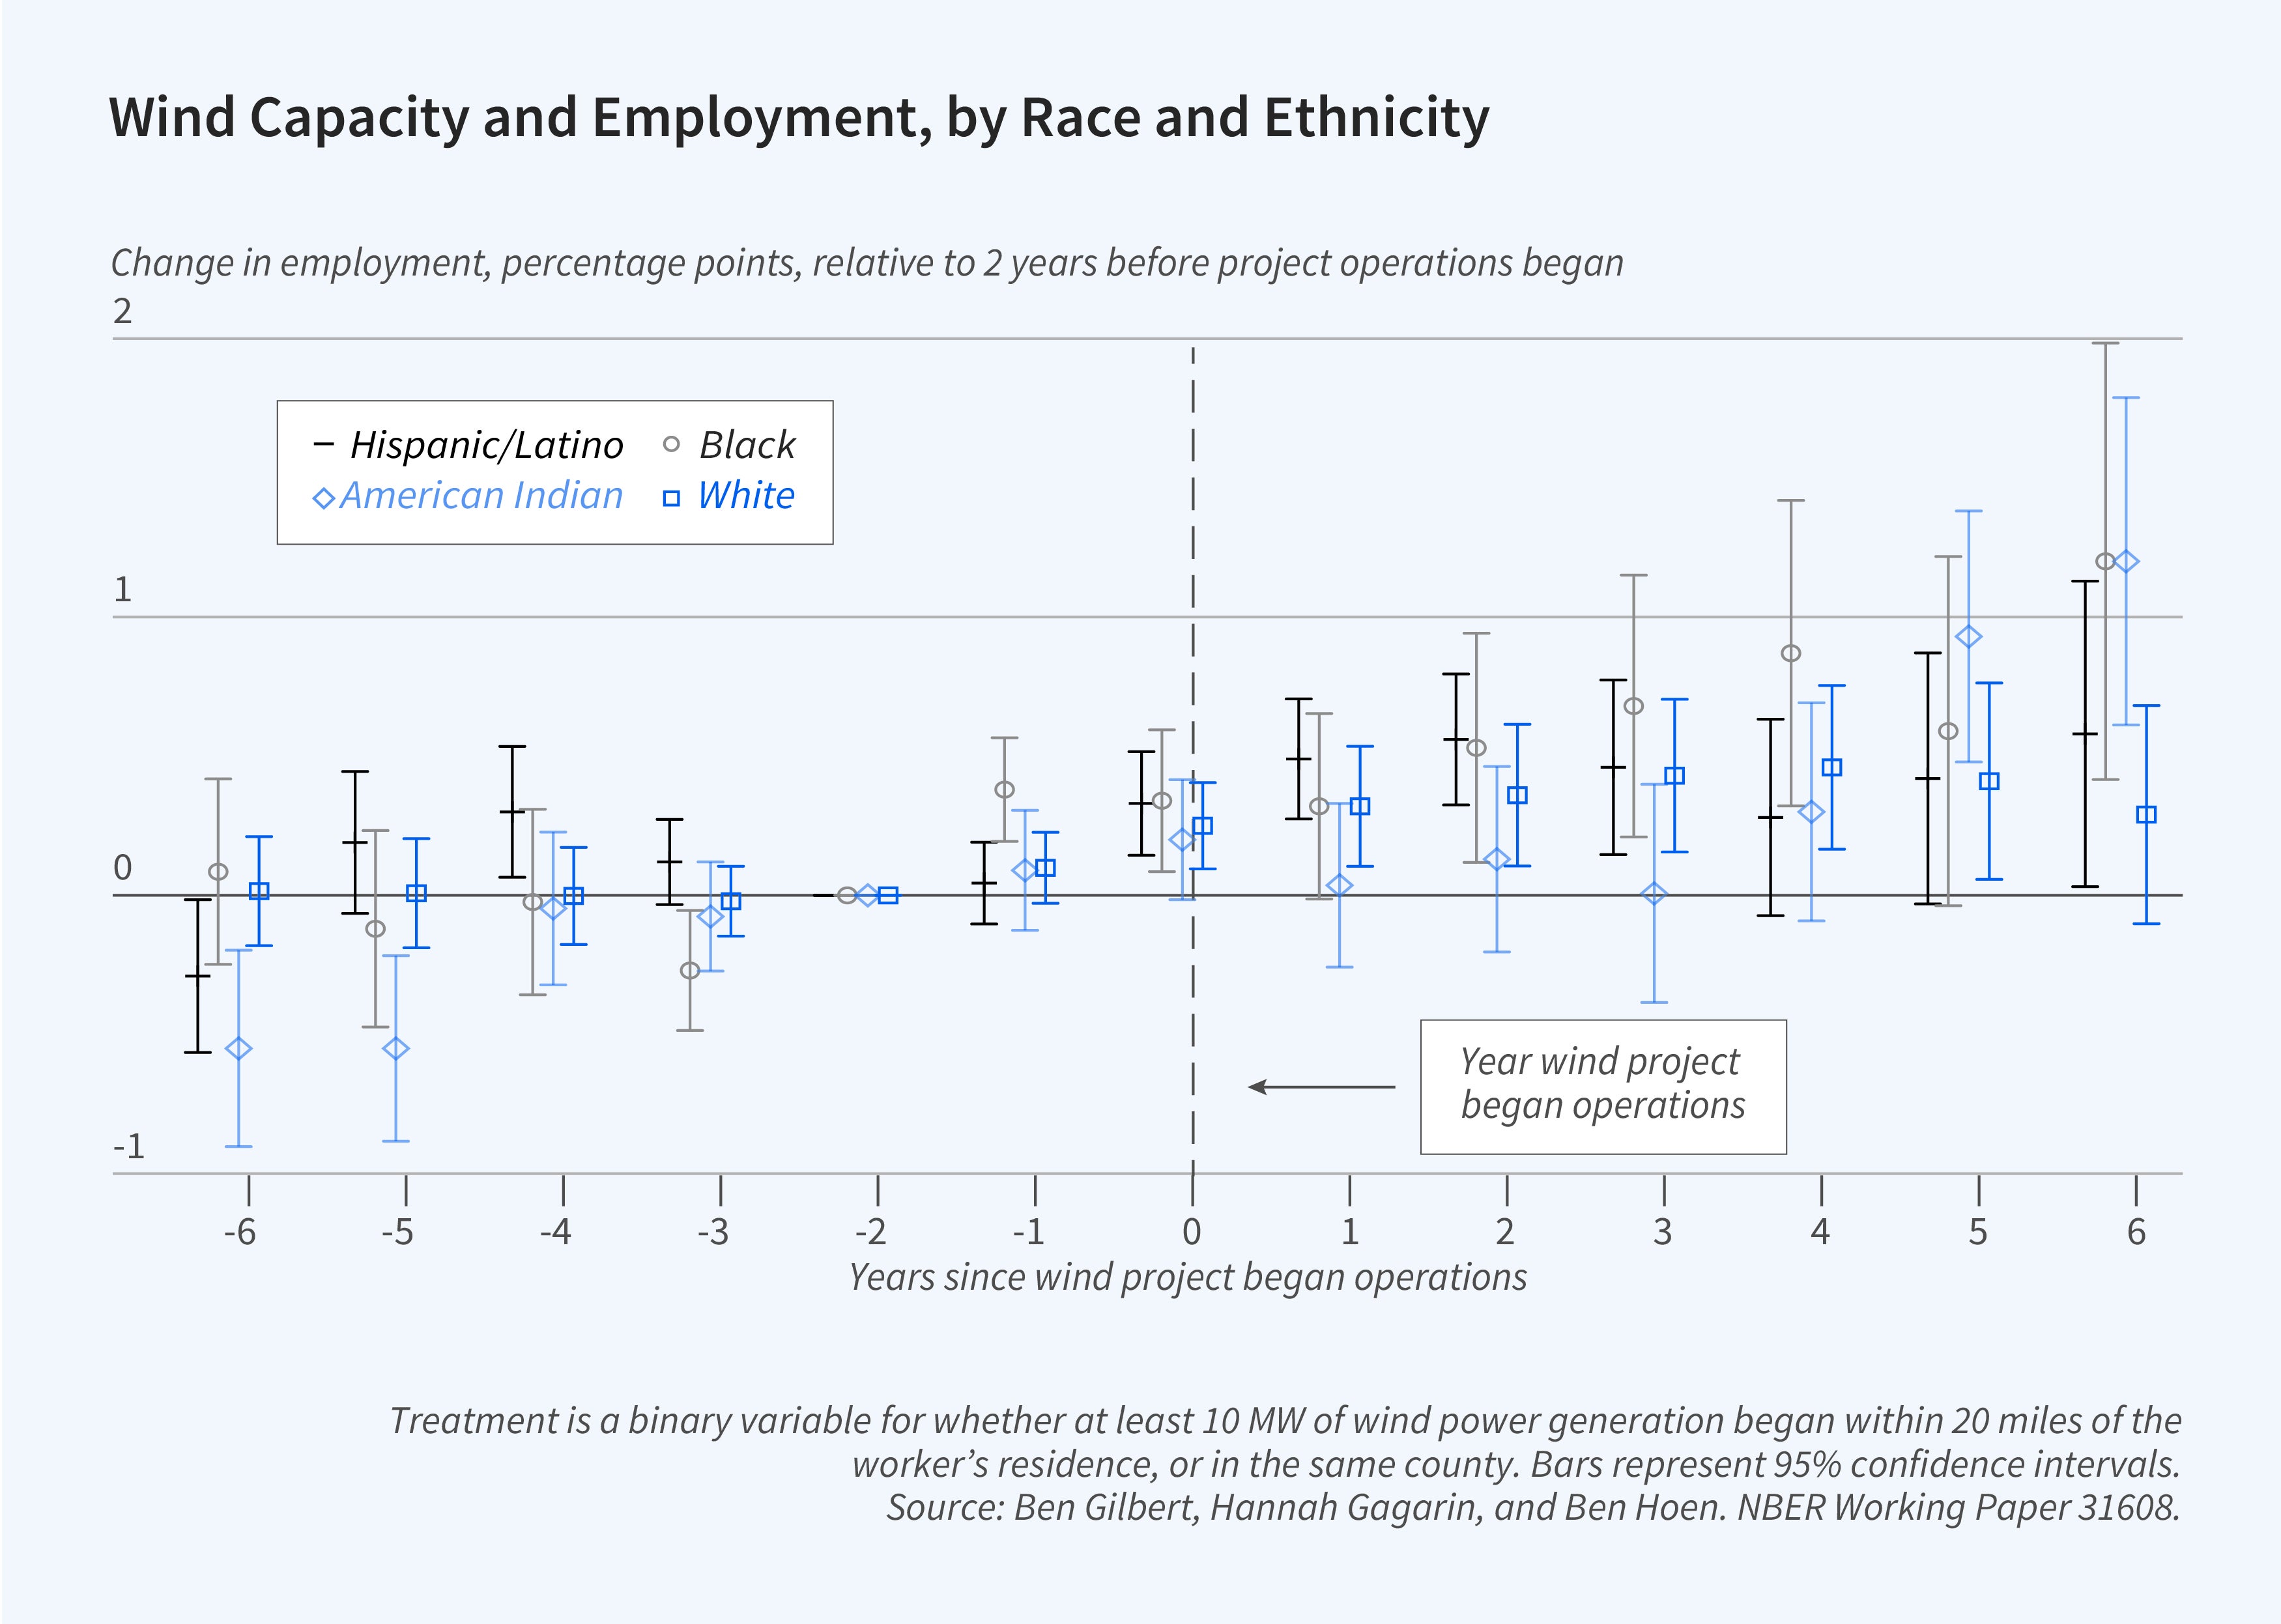
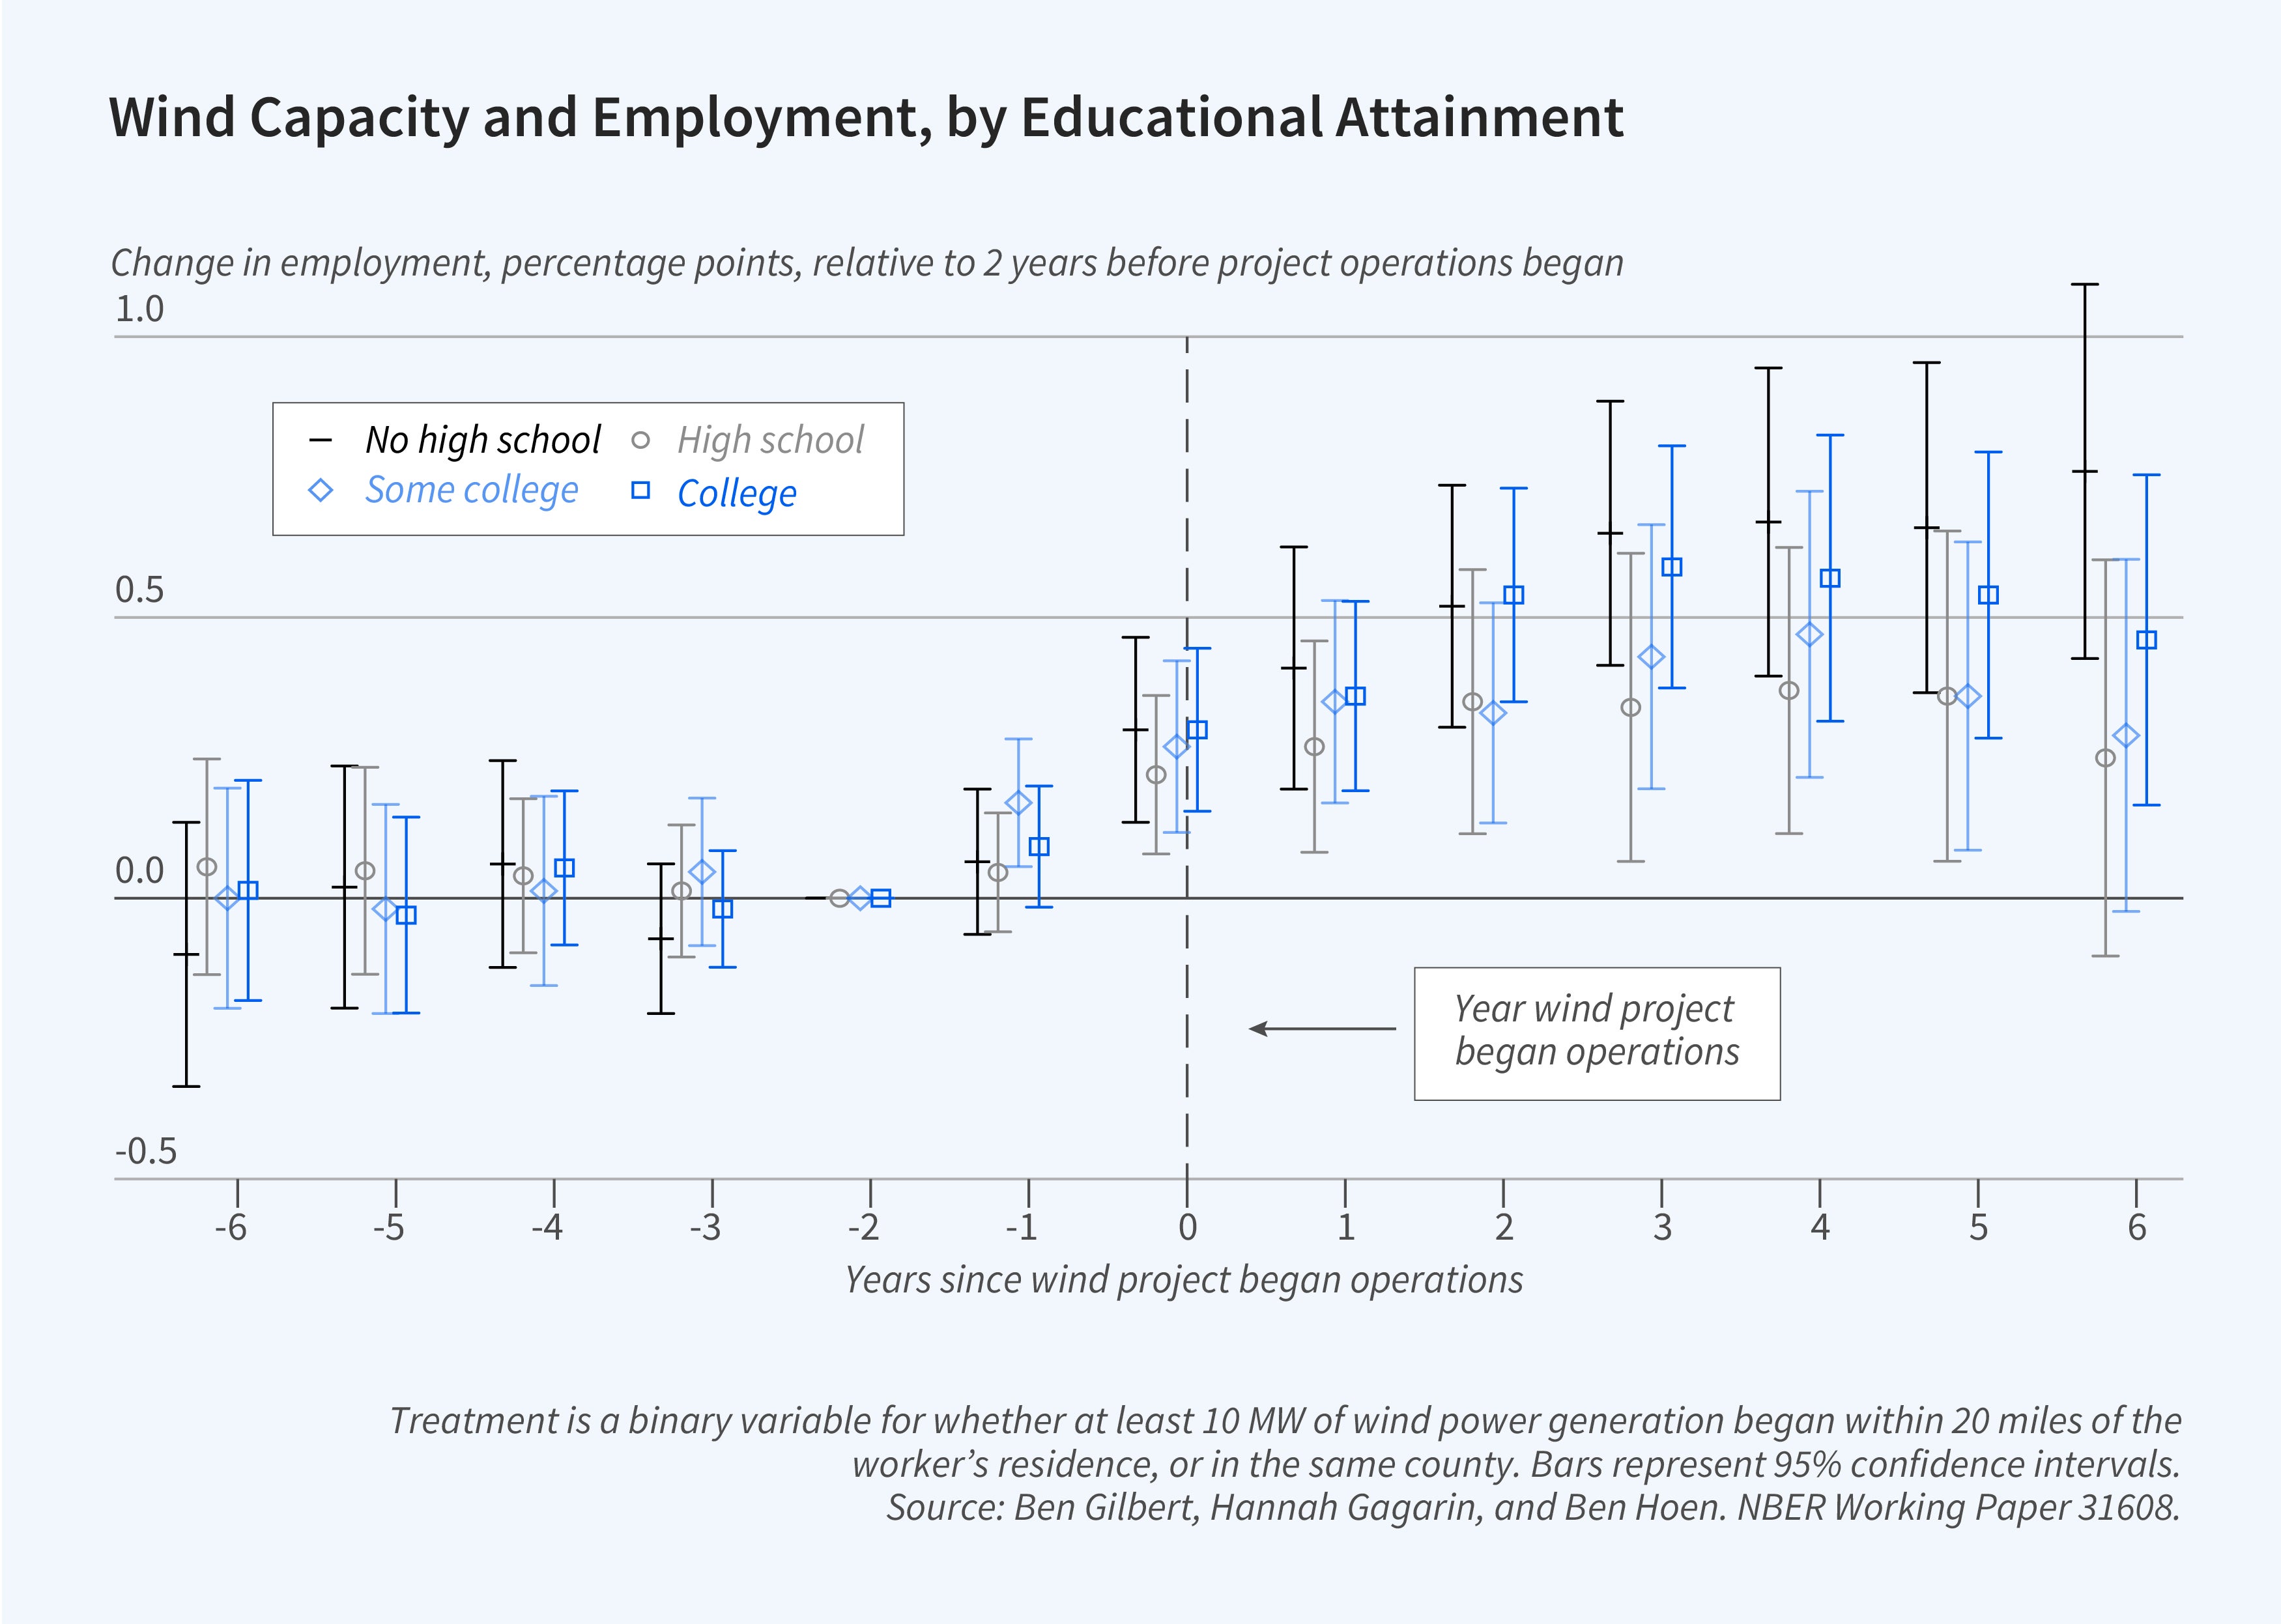
Another set of questions related to the energy transition centers around the distributional consequences of the transition. E. Mark Curtis and Ioana Marinescu document the growth in wind and solar jobs since 2010 and compare the wages of these jobs to average wage levels.7 Leveraging data from Burning Glass Technologies they find that both wind and solar jobs tripled from 2010 to 2019. They also find that these jobs tend to be located in regions of the country with a high share of fossil fuel employment. Jobs in the wind and solar sectors also pay a premium compared to the average job, and this premium is even higher when the job has a low education requirement. Ben Gilbert, Hannah Gagarin, and Ben Hoen estimate the impact of wind energy development on local earnings and employment and how these impacts vary across race, ethnicity, sex, and educational attainment.8 They find significant employment and wage impacts from utility-level wind developments, with the largest effects for Black and Native American workers, and those without a high school diploma.
Fire
With global temperatures on the rise, wildfires are becoming more frequent and more intense. The past several decades have also seen a large increase in the number of US homes located in the wildland urban interface (WUI), where housing is more affordable but wildfire risk is relatively high. The confluence of climate change, increasing fuel loads, and more people living in harm’s way raises important questions about the scale and scope of wildfire damages, wildfire risk mitigation, and climate change adaptation. Several recent papers by EEE program members explore these important topics.
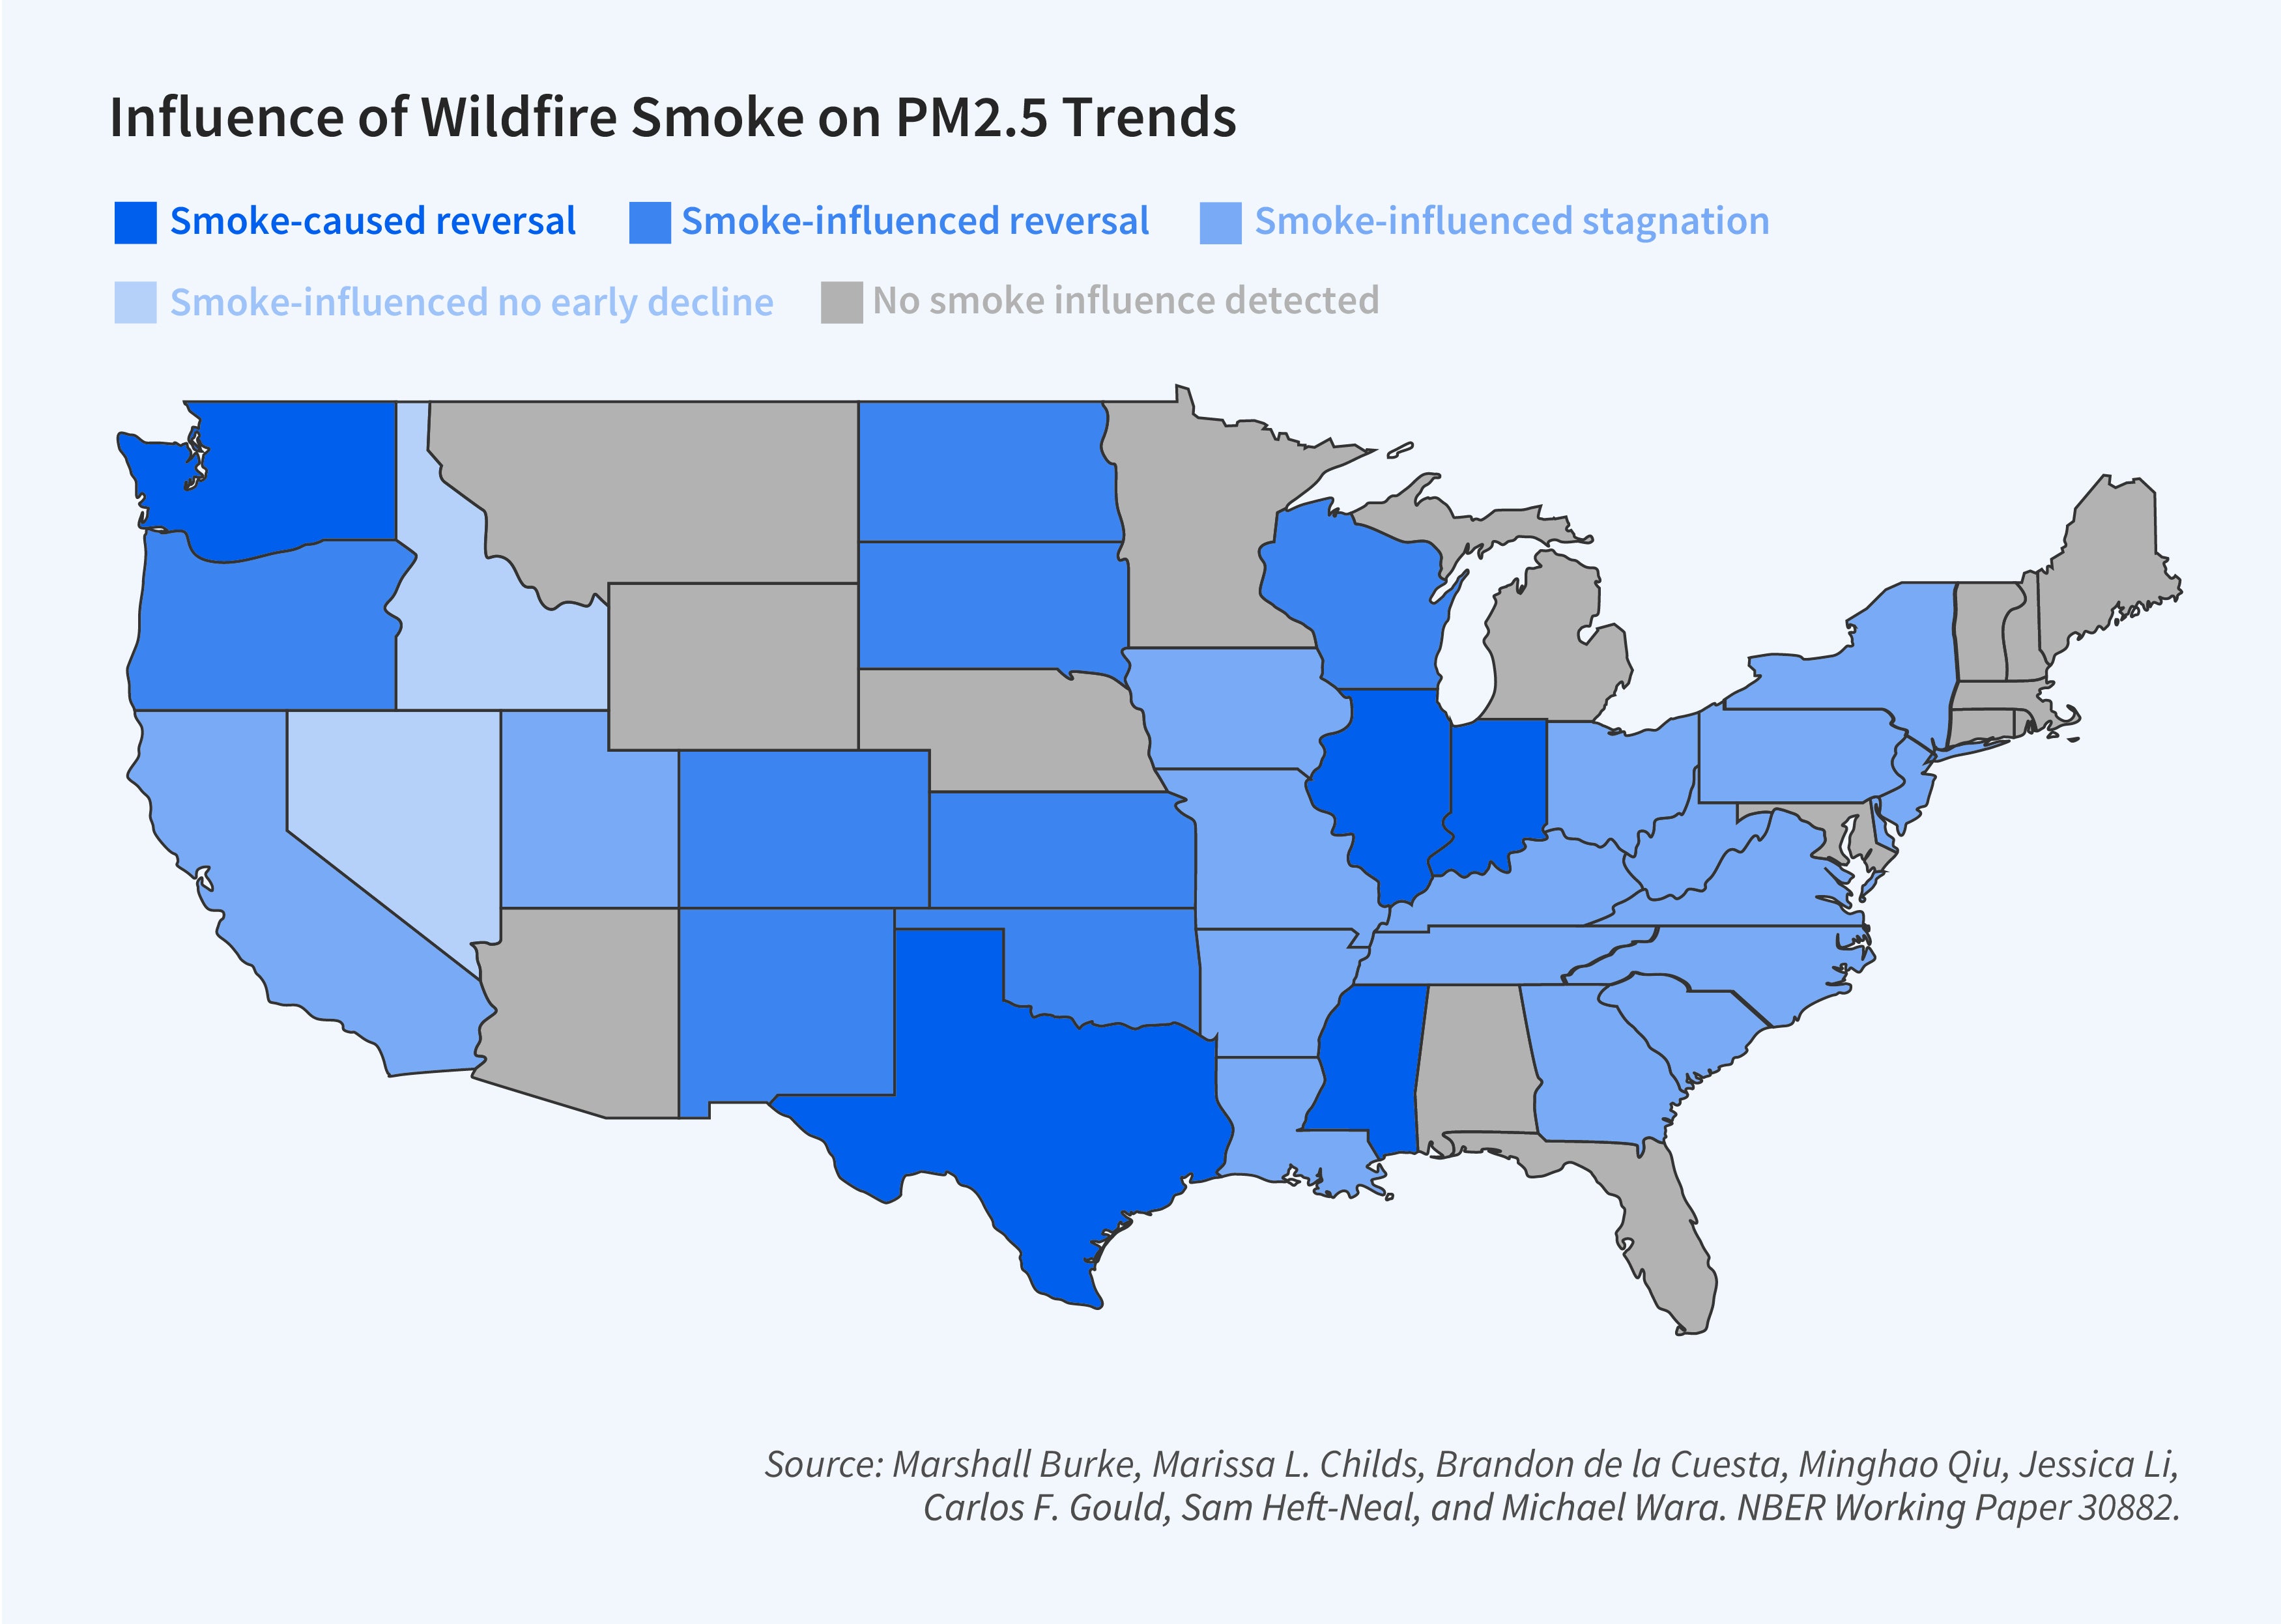
One important line of inquiry investigates the air pollution implications of increased wildfire activity. Past research has documented steady improvements in US air quality over time that can be traced to environmental policies. In recent years, however, these improvements have stagnated. Marshall Burke and coauthors quantify the contribution of wildfire smoke to these trends.9 They find that wildfire activity has slowed or reversed previous air quality improvements across two-thirds of US states. These wildfire-driven increases in air pollution concentrations are unregulated under current air quality laws. Absent policy intervention, as the climate continues to warm, the contribution of wildfires to air quality trends is likely to grow.
Related work has studied the health and economic impacts of this increased wildfire smoke. Mark Borgschulte, David Molitor, and Eric Zou estimate that an additional day of wildfire smoke exposure reduced quarterly earnings by about 0.1 percent on average.10 Extensive margin responses, including employment reductions, explain 13 percent of the overall earnings losses. They find that the estimated welfare cost of lost earnings from wildfire smoke is on par with the fires’ mortality impacts.
In addition to harmful effects on health and earnings, property damages from wildfires are on the rise. From 2013 to 2022, the share of global disaster losses caused by wildfires more than doubled compared with losses in previous decades. Investment in wildfire risk mitigation and adaptation will be important in the face of this escalating risk. Cost-effective adoption of protective measures and behaviors appears to be limited by several factors including the misperception of disaster risk, public disaster spending programs that reduce private incentives for property protection, and spatial externalities across neighboring properties that create diverging private and social benefits of mitigation. One way to overcome these barriers involves mandating investments in wildfire risk mitigation and adaptation. Patrick Baylis and Judson Boomhower study the important case of wildfire building codes in California, a state that has suffered over $40 billion in wildfire property damage in the past five years.11 They estimate the effects of these codes on own-structure survival as well as neighbor spillovers via structure-to-structure fire spread. Figure 8 shows that a home built after the building codes took effect was 40 percent less likely to be destroyed than a pre-code 1990 home experiencing an identical wildfire exposure. The authors also find code-induced mitigation of spread to neighboring homes.
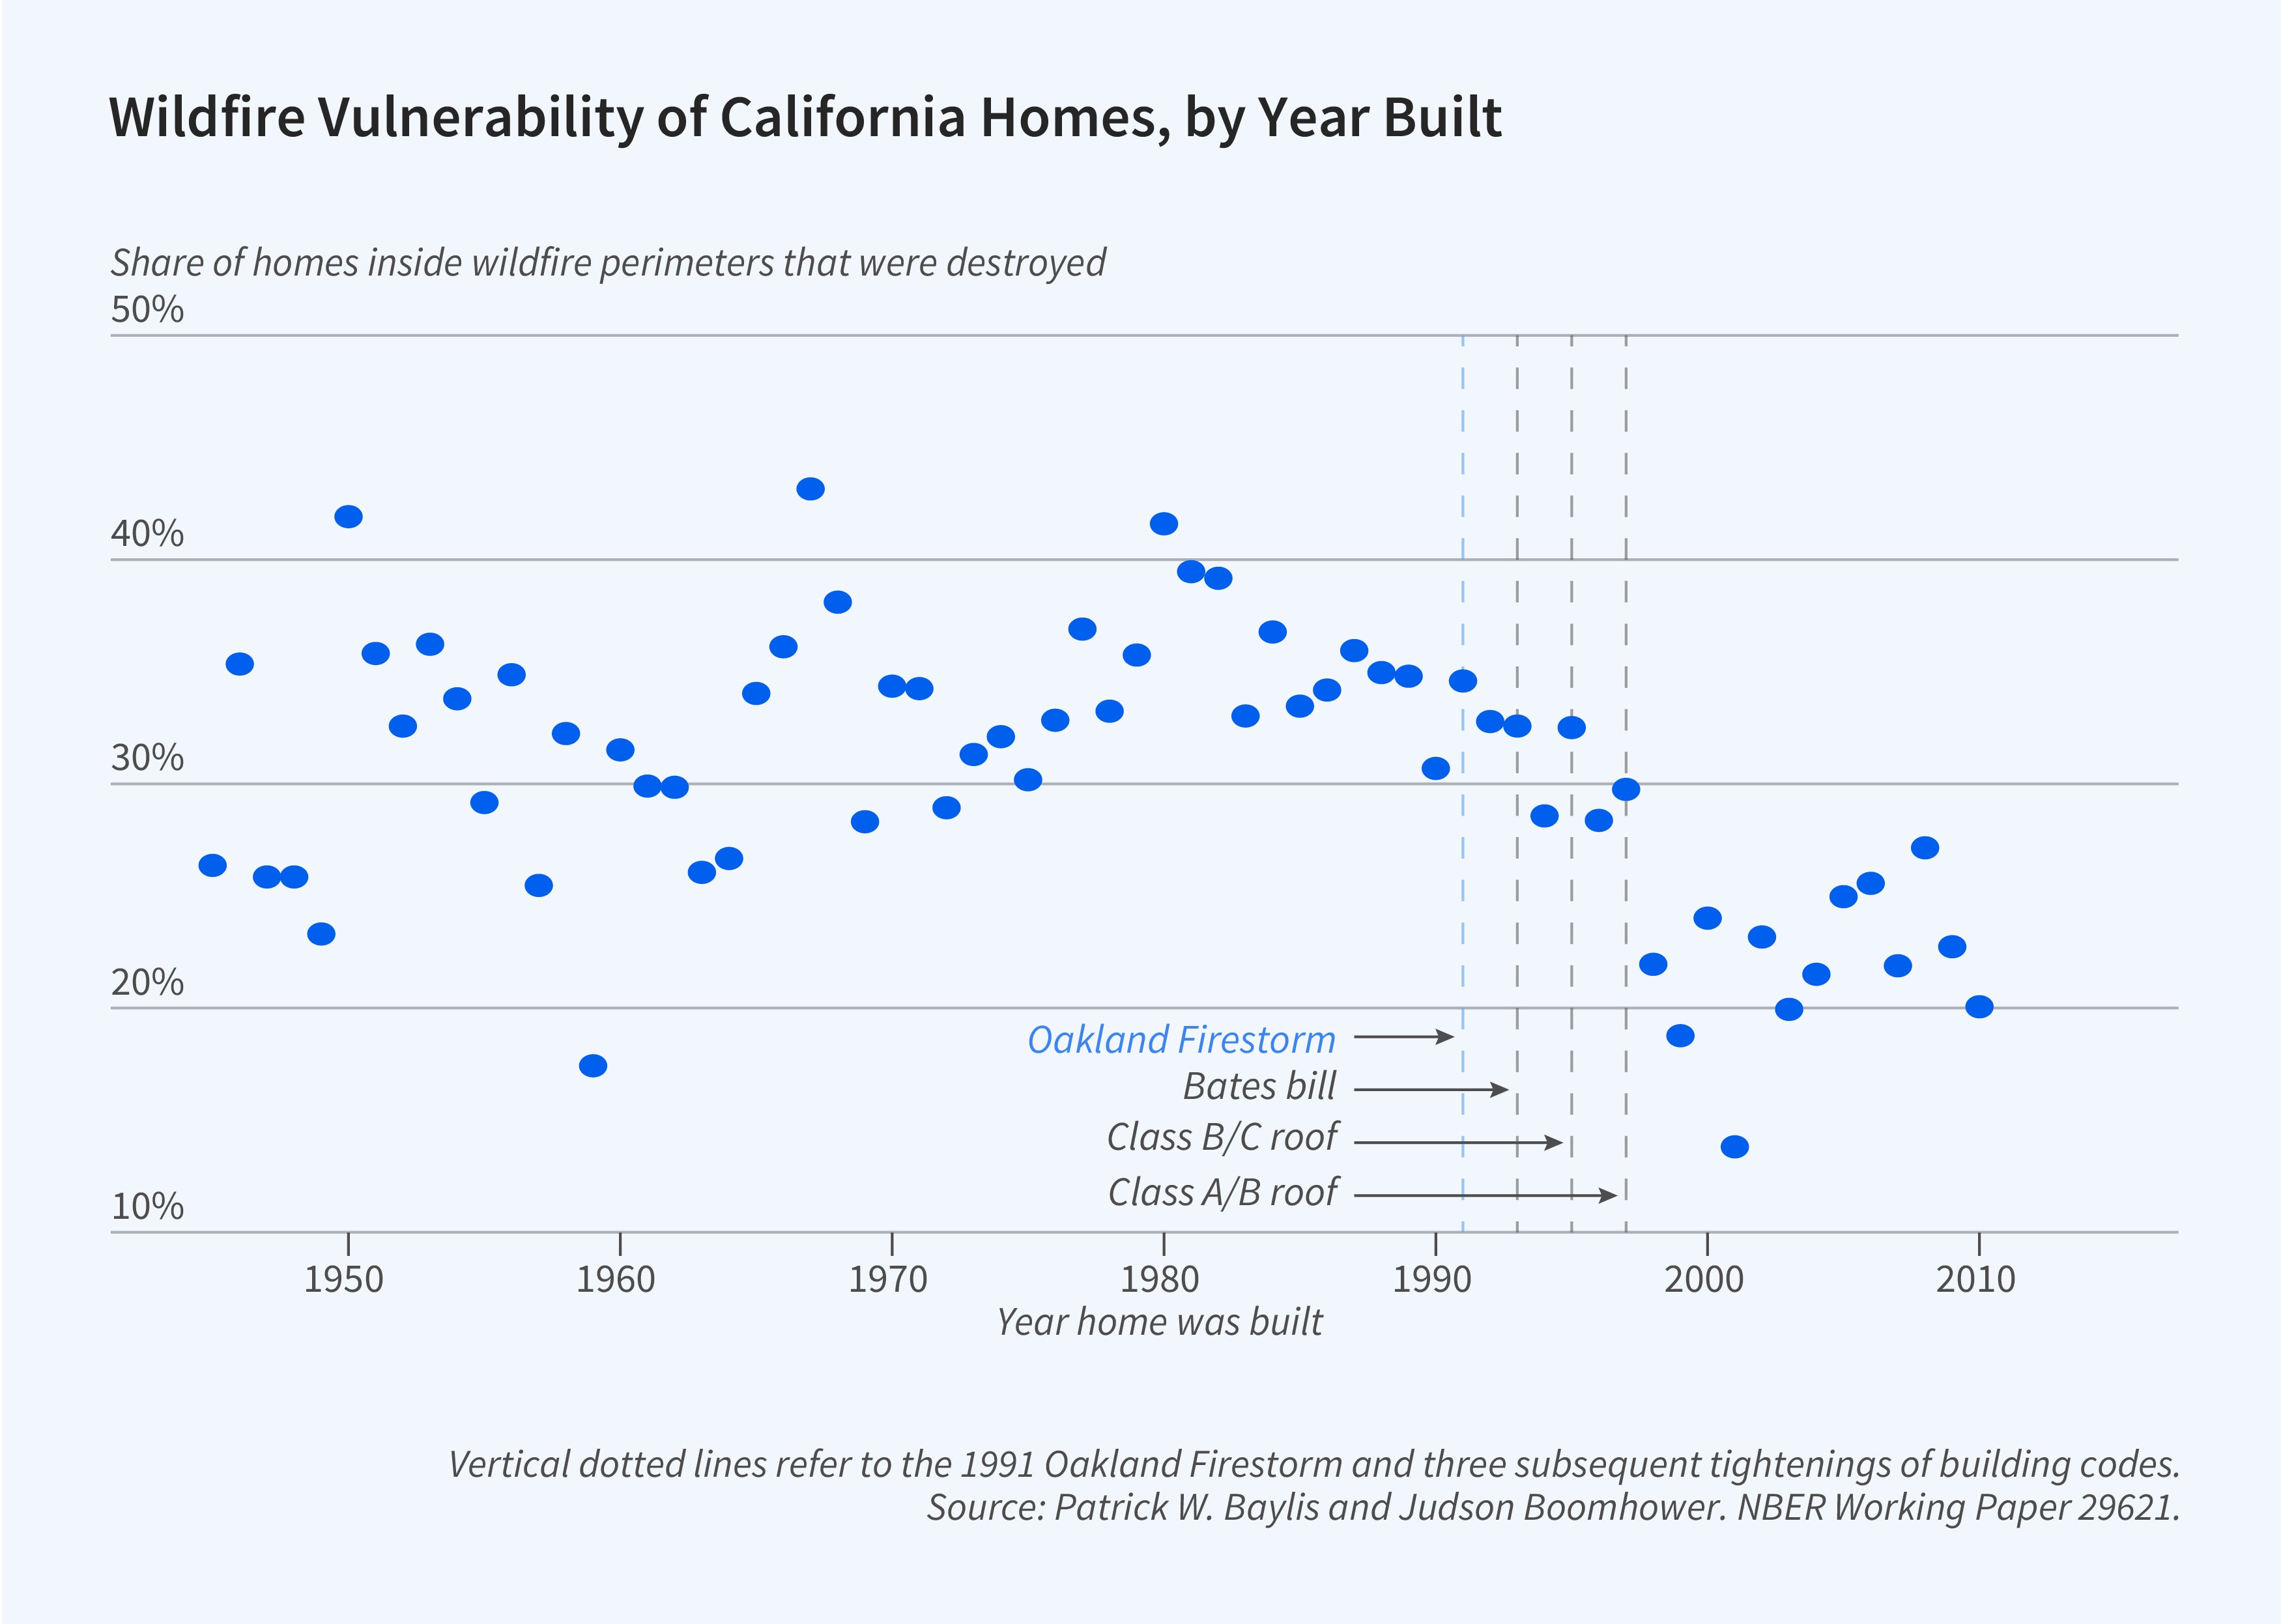
An important implication of this research is that California’s wildfire building codes have delivered unambiguously positive benefits in the most fire-prone areas of the state, especially where homes are clustered closely together and thus create a large risk of spillovers. The study also finds that given the costs of retrofitting existing homes to meet current wildfire building standards, retrofits are only economical in areas facing extreme wildfire hazards.
Conclusion
This is both a sobering and an exciting time to be an energy or environmental economist. The impacts of climate change and biodiversity loss have never been more salient. At the same time, many countries are making unprecedented commitments to conservation and investments in mitigating and adapting to climate change. Policymakers want to ensure that these efforts will deliver not only effective but also equitable outcomes. We hope and anticipate that EEE research will play a critical role in informing policy design going forward.
Endnotes
“Conservation Priorities and Environmental Offsets: Markets for Florida Wetlands,” Aronoff D, Rafey W. NBER Working Paper 31495, July 2023.
“Who Benefits from Hazardous Waste Cleanups? Evidence from the Housing Market,” Cassidy AW, Hill EL, Ma L. NBER Working Paper 30661, November 2022.
“Estimating the Spatial Amplification of Damage Caused by Degradation in the Amazon,” Araujo R, Assunção J, Hirota M, Scheinkman JA. NBER Working Paper 31550, August 2023.
“Causal Effects of Renewable Portfolio Standards on Renewable Investments and Generation: The Role of Heterogeneity and Dynamics,” Deschenes O, Malloy C, McDonald GG. NBER Working Paper 31568, August 2023.
“Decarbonization and Electrification in the Long Run,” Holland SP, Mansur ET, Yates AJ. NBER Working Paper 30082, May 2022.
“Economic Implications of the Climate Provisions of the Inflation Reduction Act,” Bistline J, Mehrotra N, Wolfram C. NBER Working Paper 31267, May 2023.
“Green Energy Jobs in the US: What Are They, and Where Are They?” Curtis EM, Marinescu I. NBER Working Paper 30332, August 2022.
“Distributional Equity in the Employment and Wage Impacts of Energy Transitions,” Gilbert B, Gagarin H, Hoen B. NBER Working Paper 31608, August 2023.
“Wildfire Influence on Recent US Pollution Trends,” Burke M, Childs ML, de la Cuesta B, Qiu M, Li J, Gould CF, Heft-Neal S, Wara M. NBER Working Paper 30882, January 2023.
“Air Pollution and the Labor Market: Evidence from Wildfire Smoke,” Borgschulte M, Molitor D, Zou E. NBER Working Paper 29952, April 2022.
“Mandated vs. Voluntary Adaptation to Natural Disasters: The Case of U.S. Wildfires,” Baylis PW, Boomhower J. NBER Working Paper 29621, December 2021.


