Quantifying 'Mortgage Rate Lock' for US Homeowners

The traditional 30-year, fixed-rate, nonassumable mortgage used by most home buyers in the United States can create strong disincentives to move when interest rates rise. In Household Mobility and Mortgage Rate Lock (NBER Working Paper 32781), Jack Liebersohn and Jesse Rothstein find that rising rates in the last three years have discouraged mobility for homeowners with fixed-rate mortgages. Because rising interest rates have increased the costs of obtaining a new mortgage relative to keeping their existing one, homeowners face high costs of moving, and many have avoided otherwise desirable moves. Because recent mortgage rate increases were much greater than those of past decades, they provide a great deal of statistical power for measuring “mortgage rate lock.”
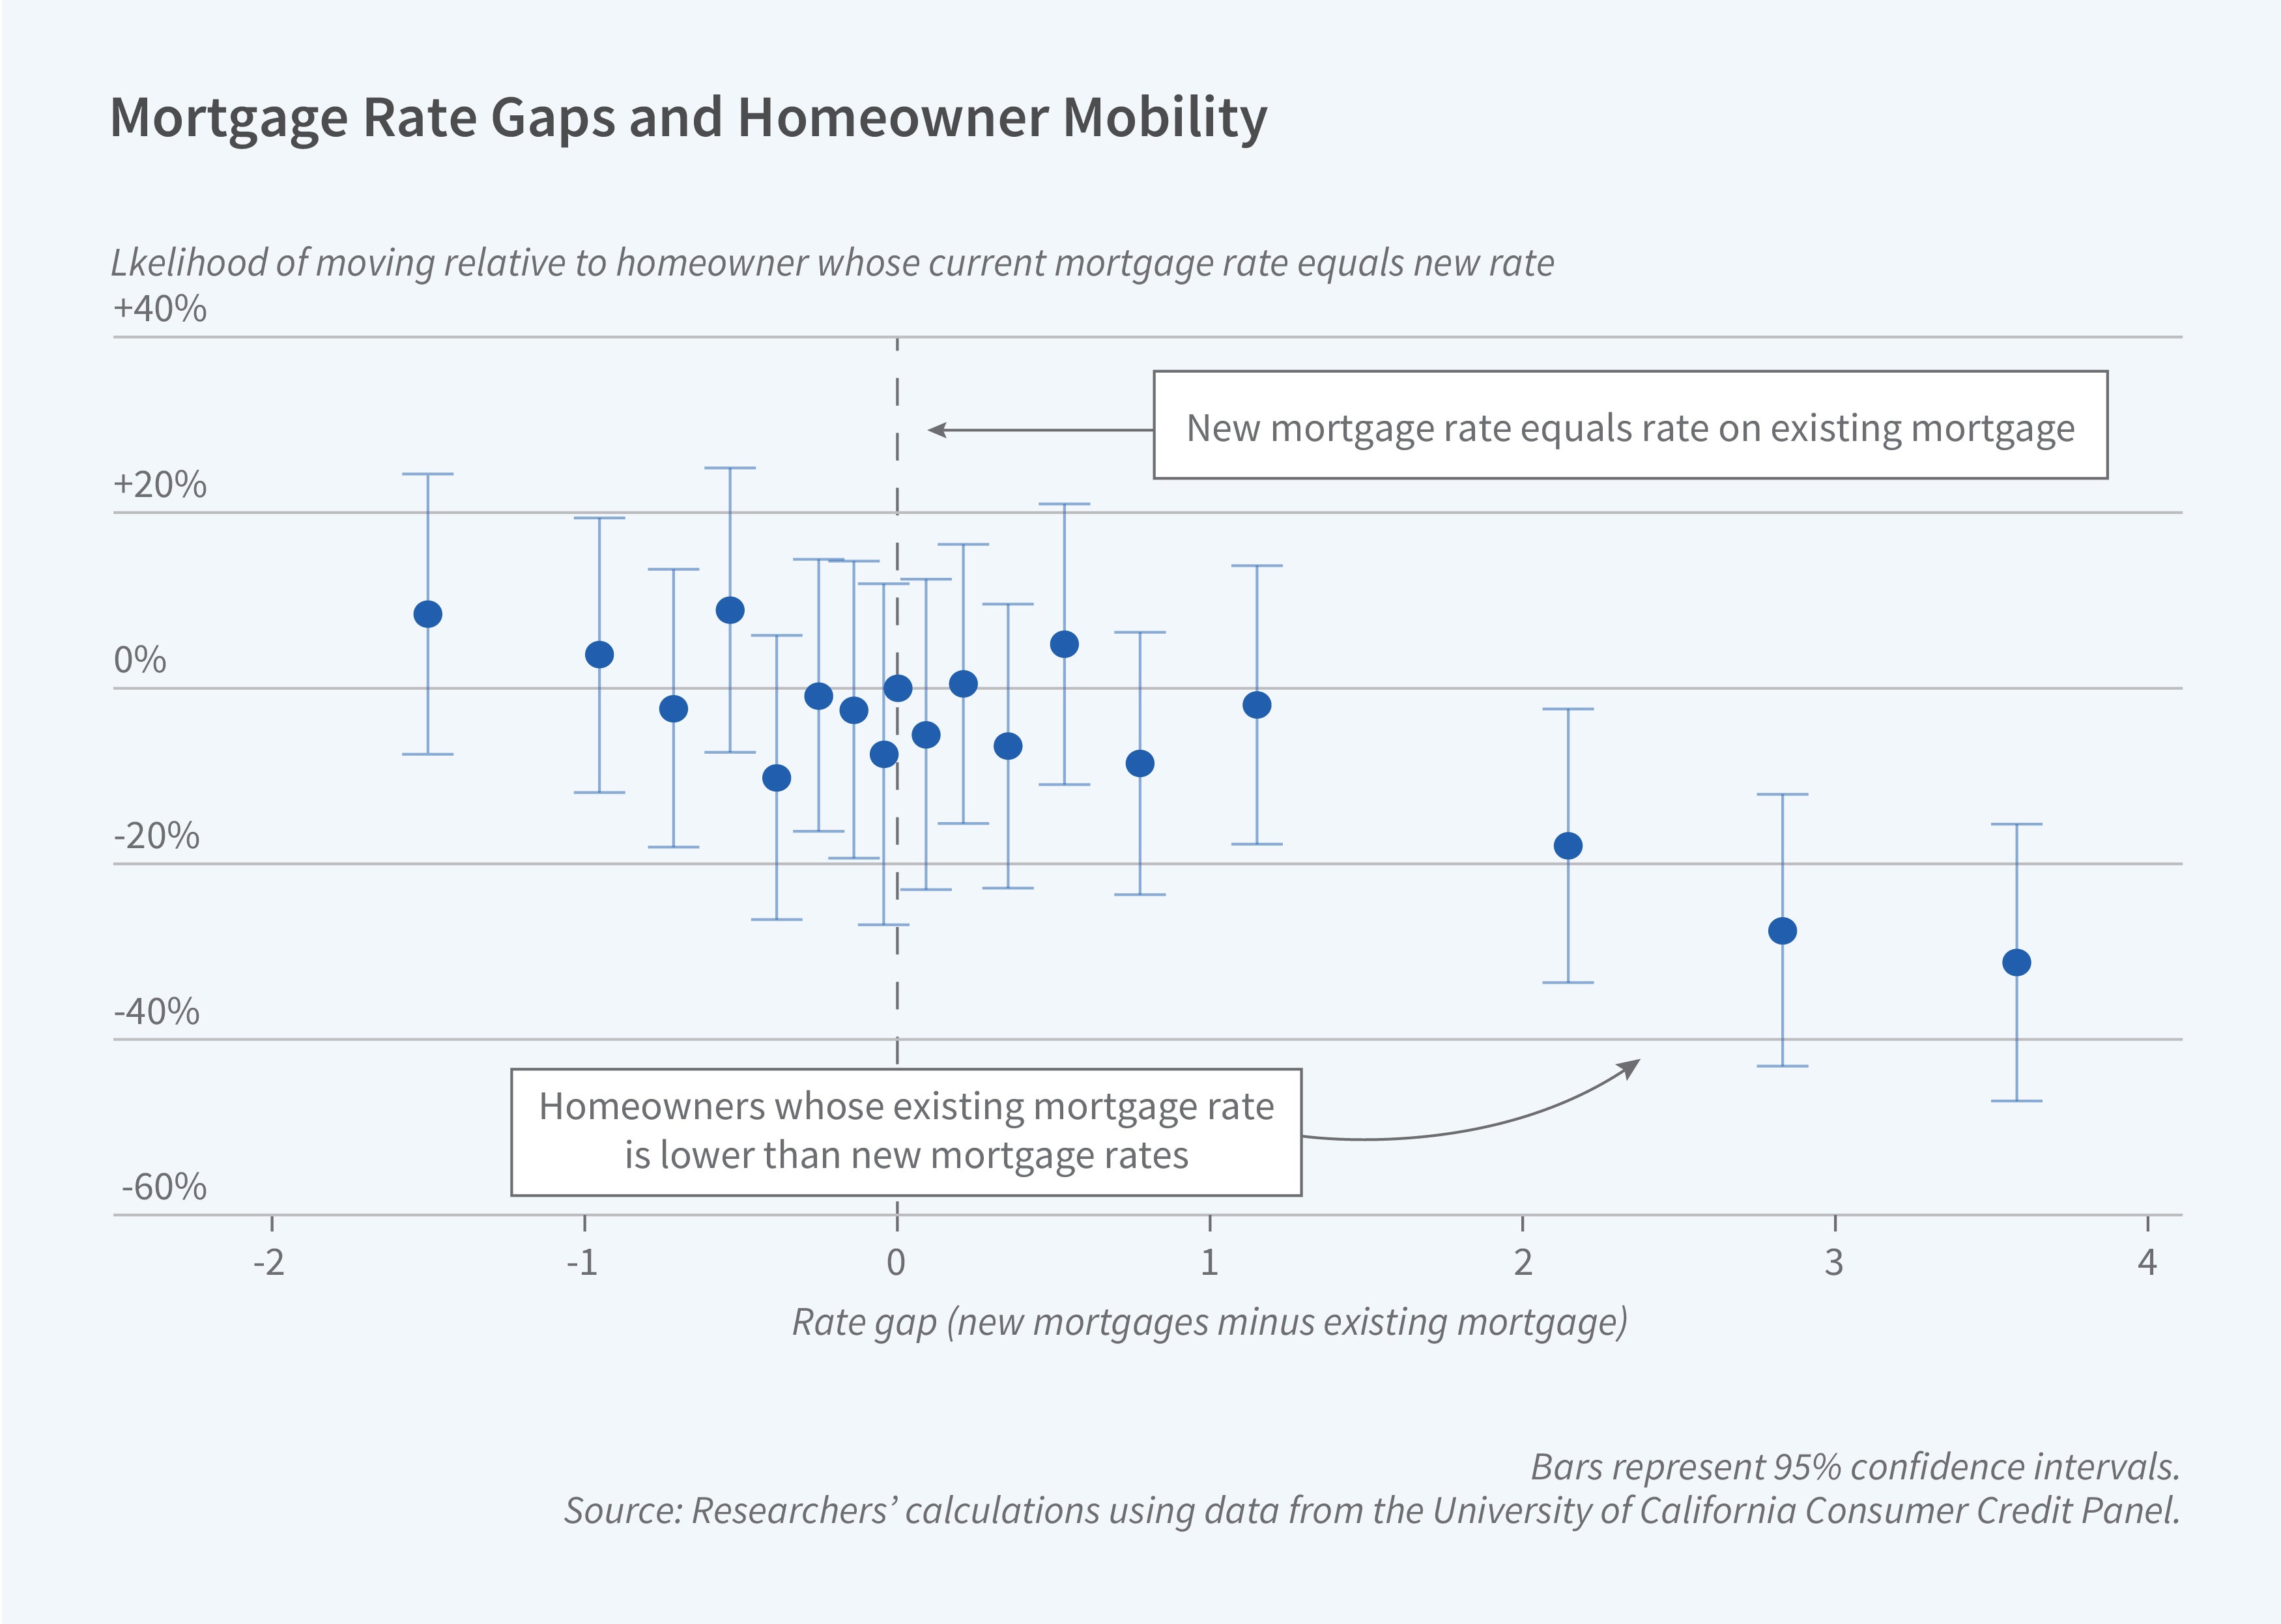
The mobility of homeowners has fallen dramatically since 2021, particularly among those whose mortgage rates were set when rates were substantially lower than current levels.
The researchers' model moving as a function of the gap between a homeowner’s mortgage origination rate and the current market rate, as well as other household characteristics. They show that mobility rates of homeowners with mortgages have fallen dramatically since 2021 and that this decline has been concentrated among homeowners with mortgages that were originated when rates were substantially lower than those that have prevailed in the last three years.
They calculate that each percentage point increase in the currently prevailing mortgage rate above a borrower’s origination rate is associated with a 7.7 percent decline in that borrower’s quarterly probability of moving. This means that between the second quarter of 2022 and the third quarter of 2023, the period of the study, mortgage rate lock caused the between-ZIP code mobility rate for homeowners with mortgages to fall by about 1.2 percentage points, or 16 percent of the projected mobility rate of 7.5 percentage points had mortgage rates remained constant. This translates into 800,000 discouraged moves during that 15-month period.
Mortgage rate lock can reduce housing market transaction volume, as some current homeowners forego moves they might otherwise have made. It can also lead homeowners to forego moves that, in the absence of rate lock, they would have made, perhaps to take advantage of new employment opportunities, and that would have made them better off. This is a source of inefficiency. For lenders, mortgage rate lock can contribute to asymmetry in the effect of interest rate changes and the typical time to mortgage payoff, reducing payoffs at exactly the times when it is most costly to lenders to hold outstanding mortgages.
—Lauri Scherer


