Health Consequences of Wildfire Smoke

Tiny, inhalable particles known as fine particulate matter (PM2.5) are a primary component of wildfire smoke and are detrimental to human health. Since smoke can drift hundreds of miles from its source, exposure to these pollutants is widespread: wildfire smoke accounts for about 18 percent of the ambient PM2.5 concentrations affecting the US population.
In The Nonlinear Effects of Air Pollution on Health: Evidence from Wildfire Smoke (NBER Working Paper 32924), Nolan H. Miller, David Molitor, and Eric Zou leverage variation in the location of wildfire smoke plumes across counties and over time to show that air pollution increases mortality and hospital use among older adults. They link daily health outcomes from Medicare data to ground-level air quality data from the Environmental Protection Agency and wildfire smoke plume data from the National Oceanic and Atmospheric Administration.
Tracing out the impact of a shock to local air quality from a wildfire smoke plume, the researchers show that air quality deteriorates on the day that smoke arrives, with effects persisting for three days. PM2.5 concentrations increase by up to 158 percent, relative to the smoke-free mean, in counties directly under a wildfire smoke plume. Pollution diminishes with distance from the plume and with lower-density plumes.
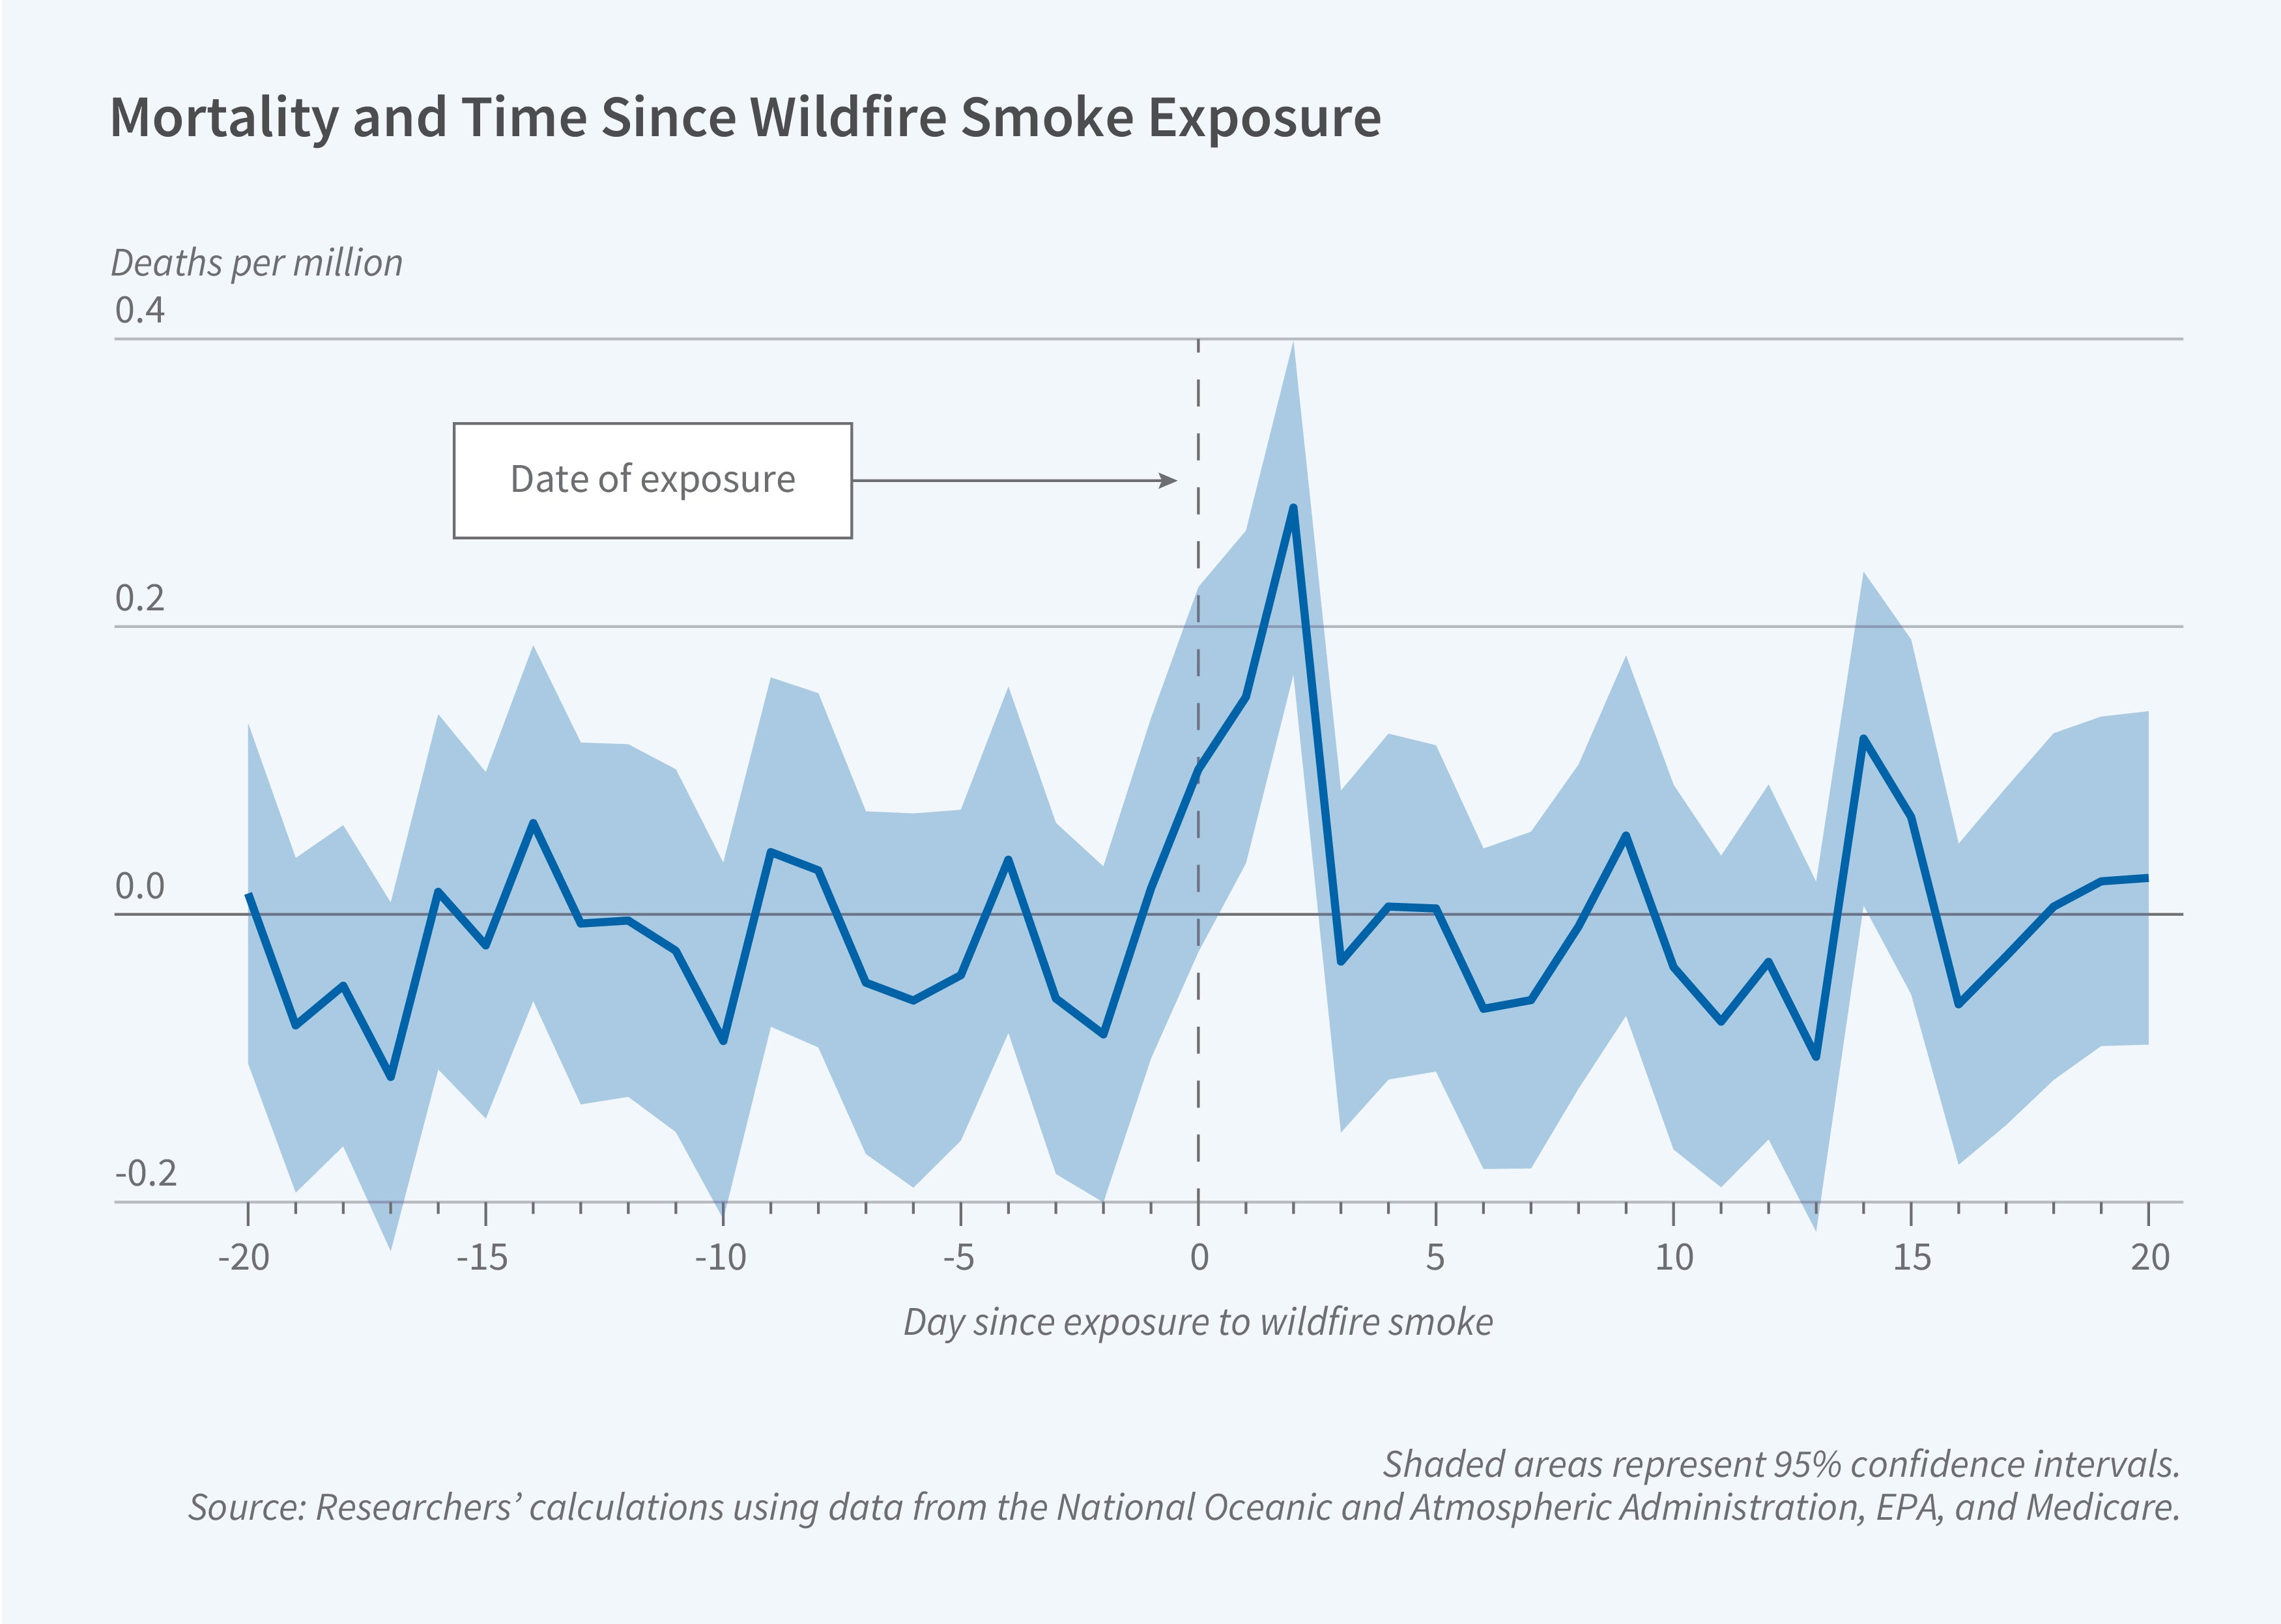
The timing of adverse health effects mirrors the timing of air quality deterioration. Emergency department (ED) visits increase sharply on the first day of exposure, with the average wildfire smoke plume increasing visits by 10 per million Medicare beneficiaries (0.7 percent of the baseline rate) within three days. Mortality rises more gradually, peaking two days after the exposure, increasing by 0.5 per million Medicare beneficiaries (0.4 percent) within three days.

Affected counties do not experience an offsetting decline in ED visits or mortality in subsequent weeks. This finding suggests that wildfire smoke does not merely accelerate health outcomes that would have otherwise occurred within a few weeks. Based on their estimates, the researchers calculate that each year, wildfire smoke exposure causes 10,070 premature deaths and 191,541 excess ED visits among Americans over the age of 65.
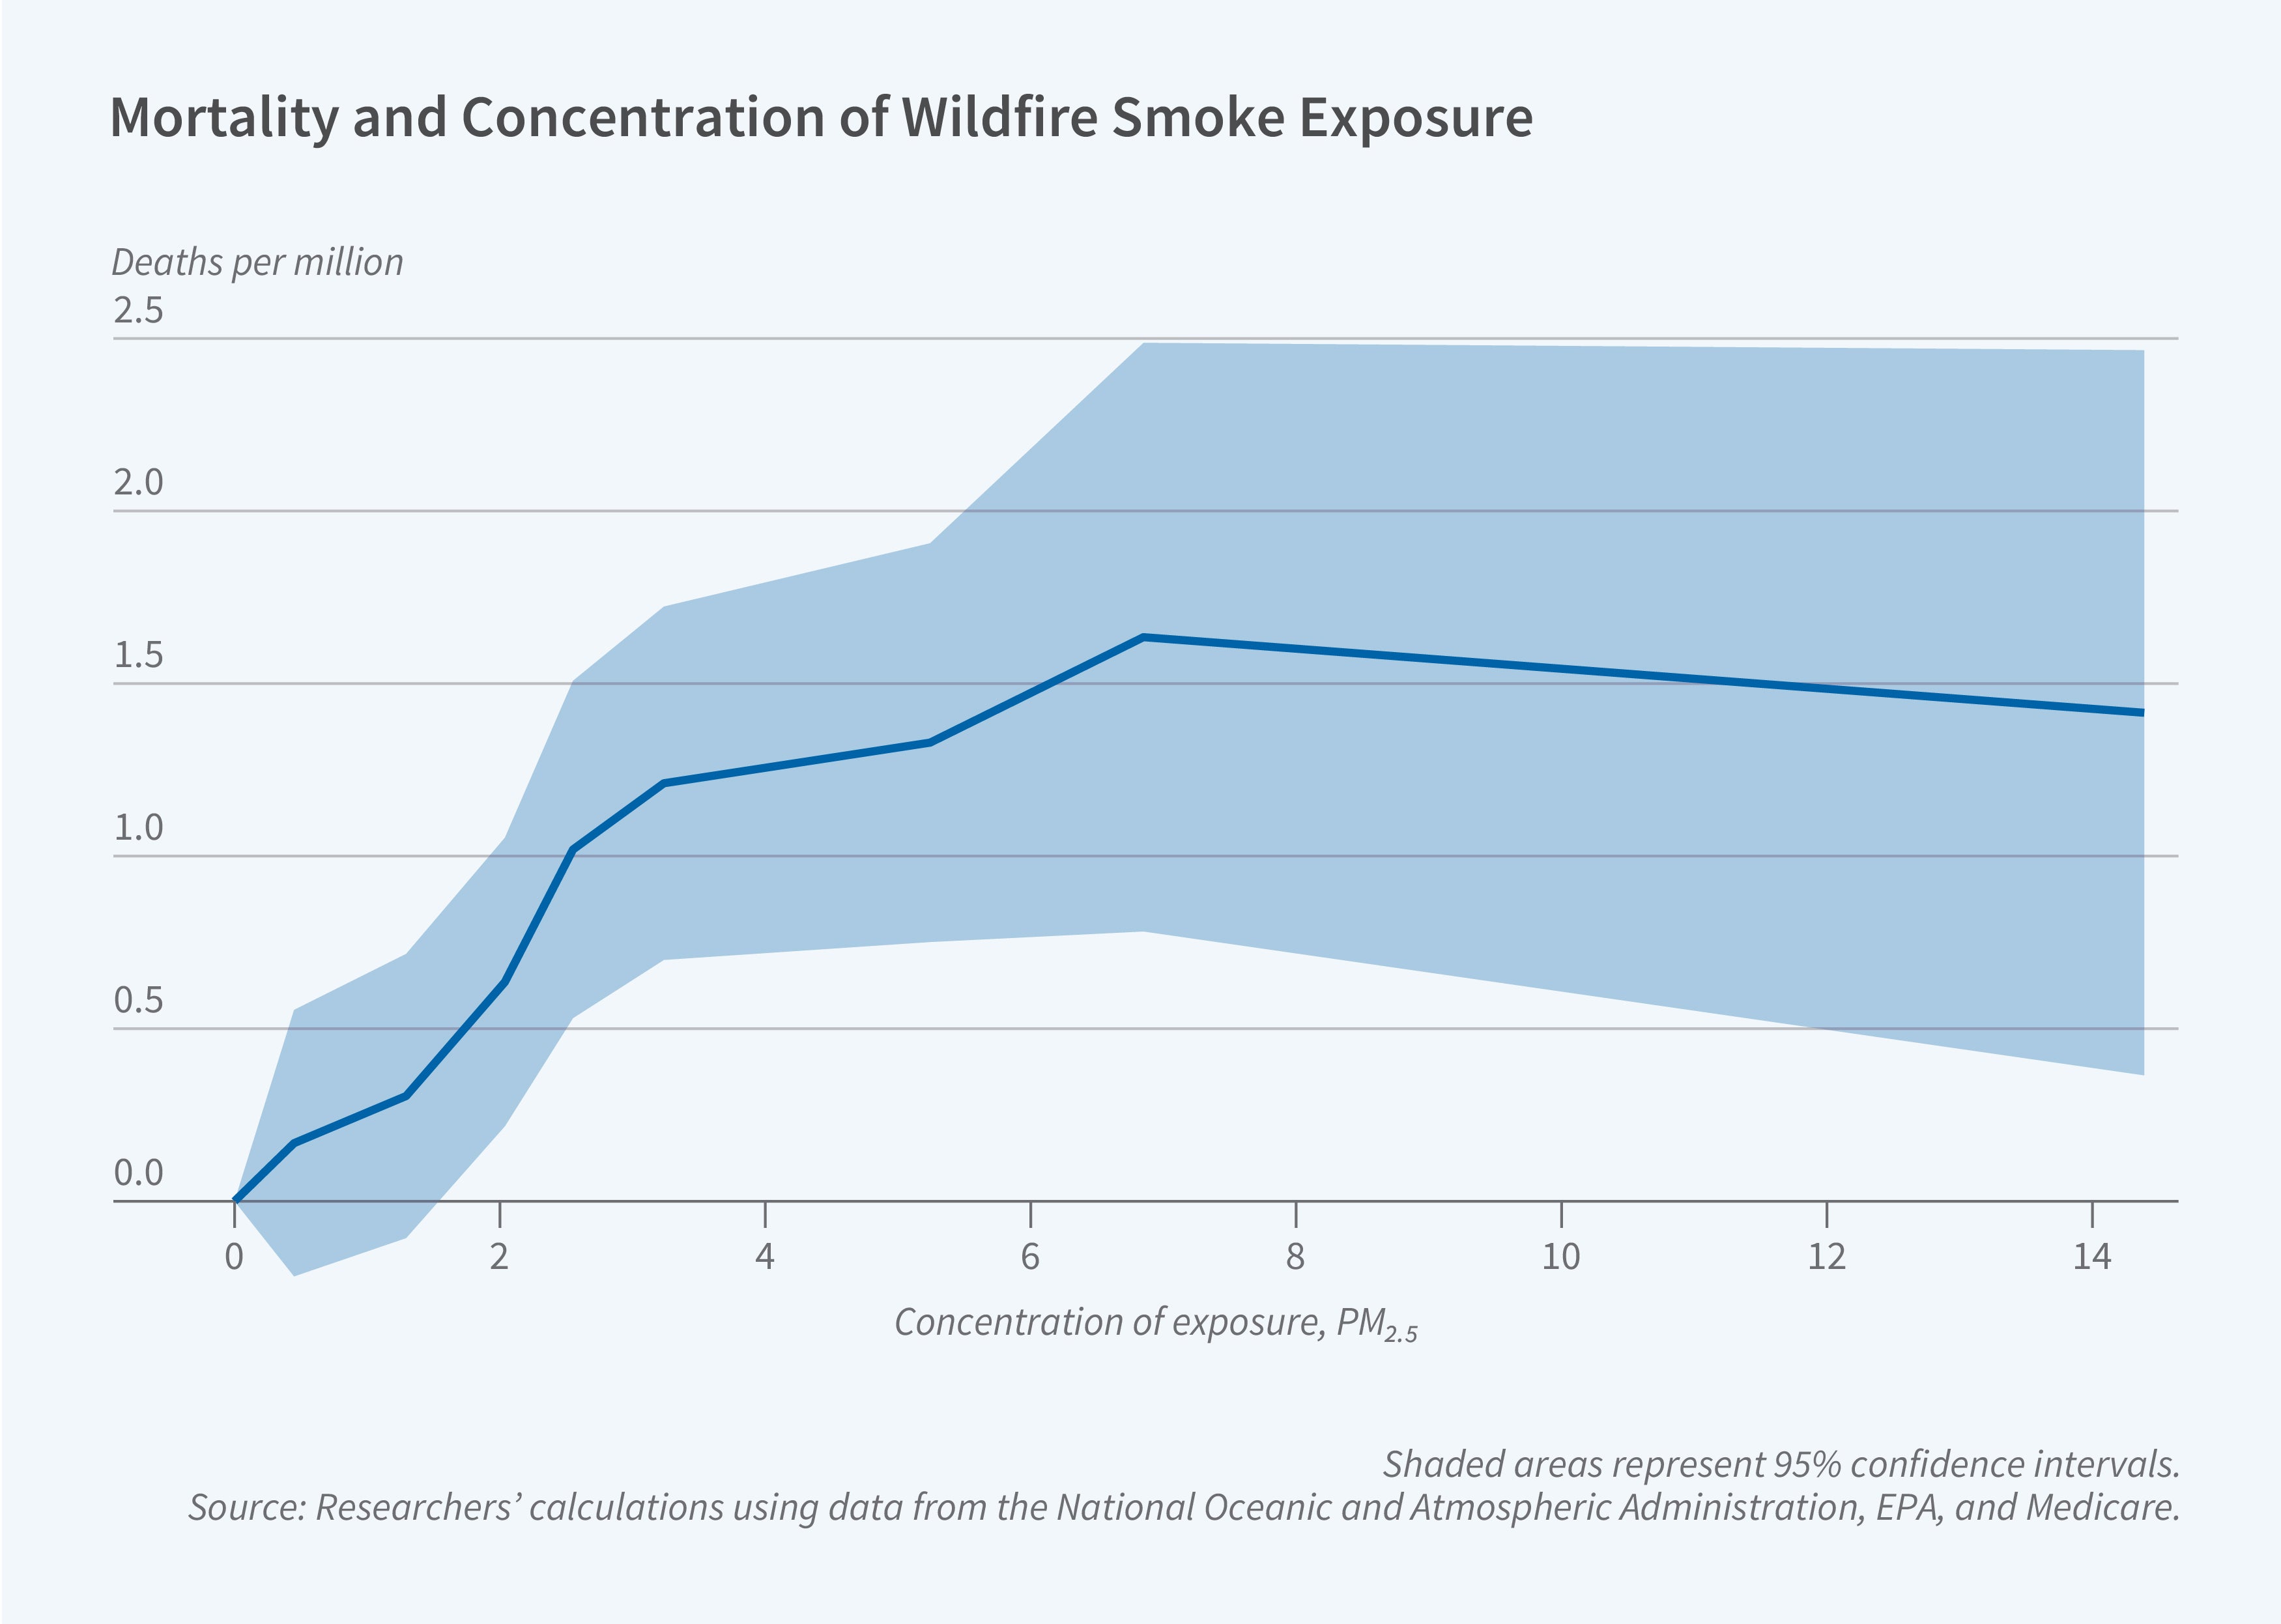
The researchers find that the deterioration in health outcomes per unit increase in PM2.5 is largest for small increases in pollution. For larger shocks, the health consequences plateau. This nonlinear pattern may reflect individual efforts to avoid exposure, such as by reducing outdoor activities on particularly smoky days. These results indicate that improvements in air quality could have beneficial health effects, even at relatively low levels of pollution that comply with current air quality standards.
— Robin McKnight
This research was supported by the National Institute on Aging of the National Institutes of Health under award numbers P01AG005842, R01AG053350, and R01AG073365.


