Program Report: Corporate Finance
The NBER Corporate Finance Program has been a leading research forum in the field since it was established in 1991. Corporate finance questions intersect with many areas of finance and economics, including macrofinance, asset pricing, financial intermediation, and organizational economics. This breadth of topics is reflected in the work presented at the Corporate Finance program meetings. The importance of the field has been widely recognized in academia and is evidenced by the 2022 Nobel Memorial Prize in Economic Sciences for Ben Bernanke, Douglas Diamond, and Philip Dybvig’s work on banking and intermediation. In this report, we cannot do justice to the entire field, but we must select a few topics that have been addressed in a number of recent NBER Working Papers or in presentations at NBER conferences.
Scholars affiliated with the Corporate Finance Program continue to expand our understanding of classic questions, such as the drivers of firm valuation or the importance of CEO compensation and capital structure. Better data are at the heart of many recent advances. For example, Paul Décaire and John Graham extract information from analysts’ research reports to elucidate the various assumptions made when valuing companies. A core lesson from their work is that fluctuations in both expected growth rates and discount rates play an important role in variations in valuations over time.1 Niels Joachim Gormsen and Kilian Huber uncover estimates of discount rates and the cost of capital used by managers by studying earnings calls.2 They show that measures of the cost of capital reported by managers fall over time, but the discount rates the managers use to actually make investment decisions do not. Itzhak Ben-David and Alexander Chinco focus on information collected from a variety of sources including 10-K filings, analyst reports, and surveys of managers to present the idea that many managers maximize earnings per share instead of net present value, in contrast with the most basic lesson taught in corporate finance.3
At the same time, the scope of questions being asked is broadening in response to the changing nature of the firm itself and new risk factors confronting firms and the economy, such as intangible capital, environmental, social, and governance (ESG) policies, and financial stability.
Intangible Capital
A central question in corporate finance is how firms create value, both for the firm’s claimants and for society. The traditional setting focuses on firm investment in physical capital as the primary source of value creation. However, the nature of how firms add value to the economy has changed significantly over time. Firms innovate through research and development, they bring together and enhance human capital, and their activities may have important spillovers for the broader economy.
Collectively, firm value creation strategies other than physical capital investment are often summarized as investments in intangible capital. The importance of intangible capital can be gleaned from aggregate valuation ratios and investment patterns, as illustrated by Germán Gutiérrez and Thomas Philippon.4 The value of Tobin’s q, the ratio of enterprise value to physical capital, has trended upward significantly since 1980, as shown in Figure 1. In the classic framework of Fumio Hayashi, a high value of Tobin’s q should induce more physical capital investment.5 However, despite the high level of Tobin’s q, measures of physical capital investment have actually fallen, as shown in Figure 2.
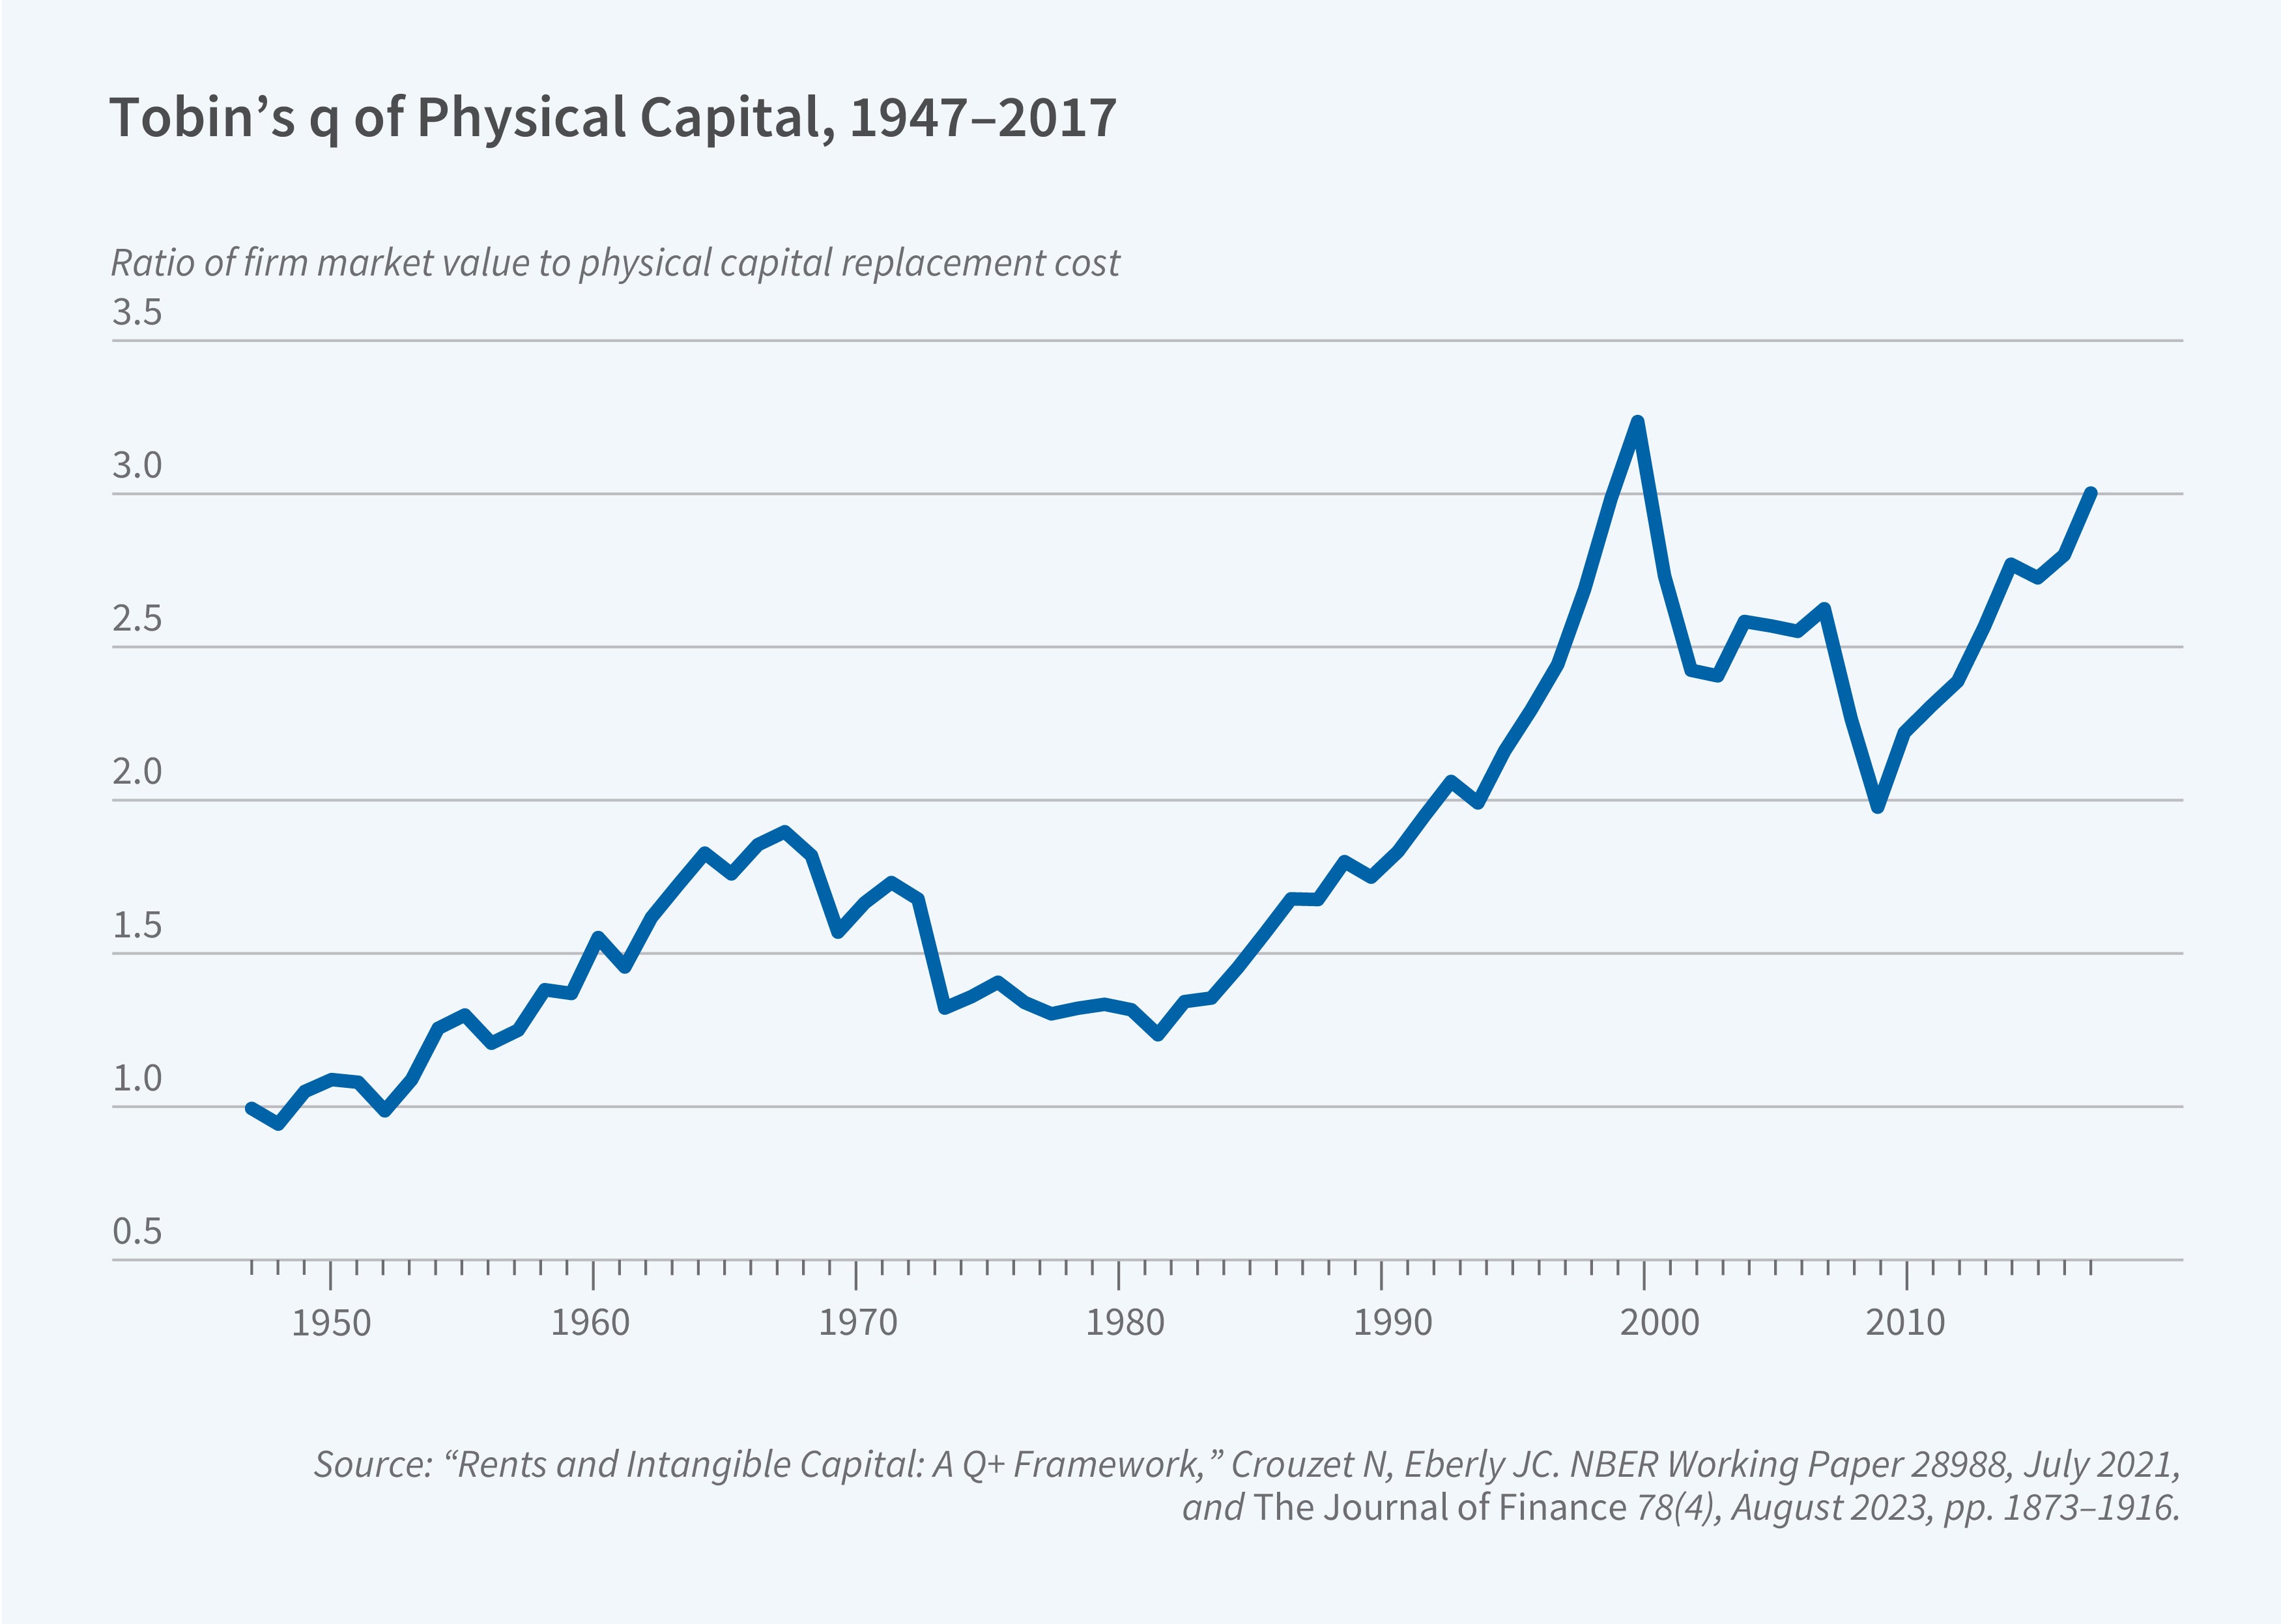
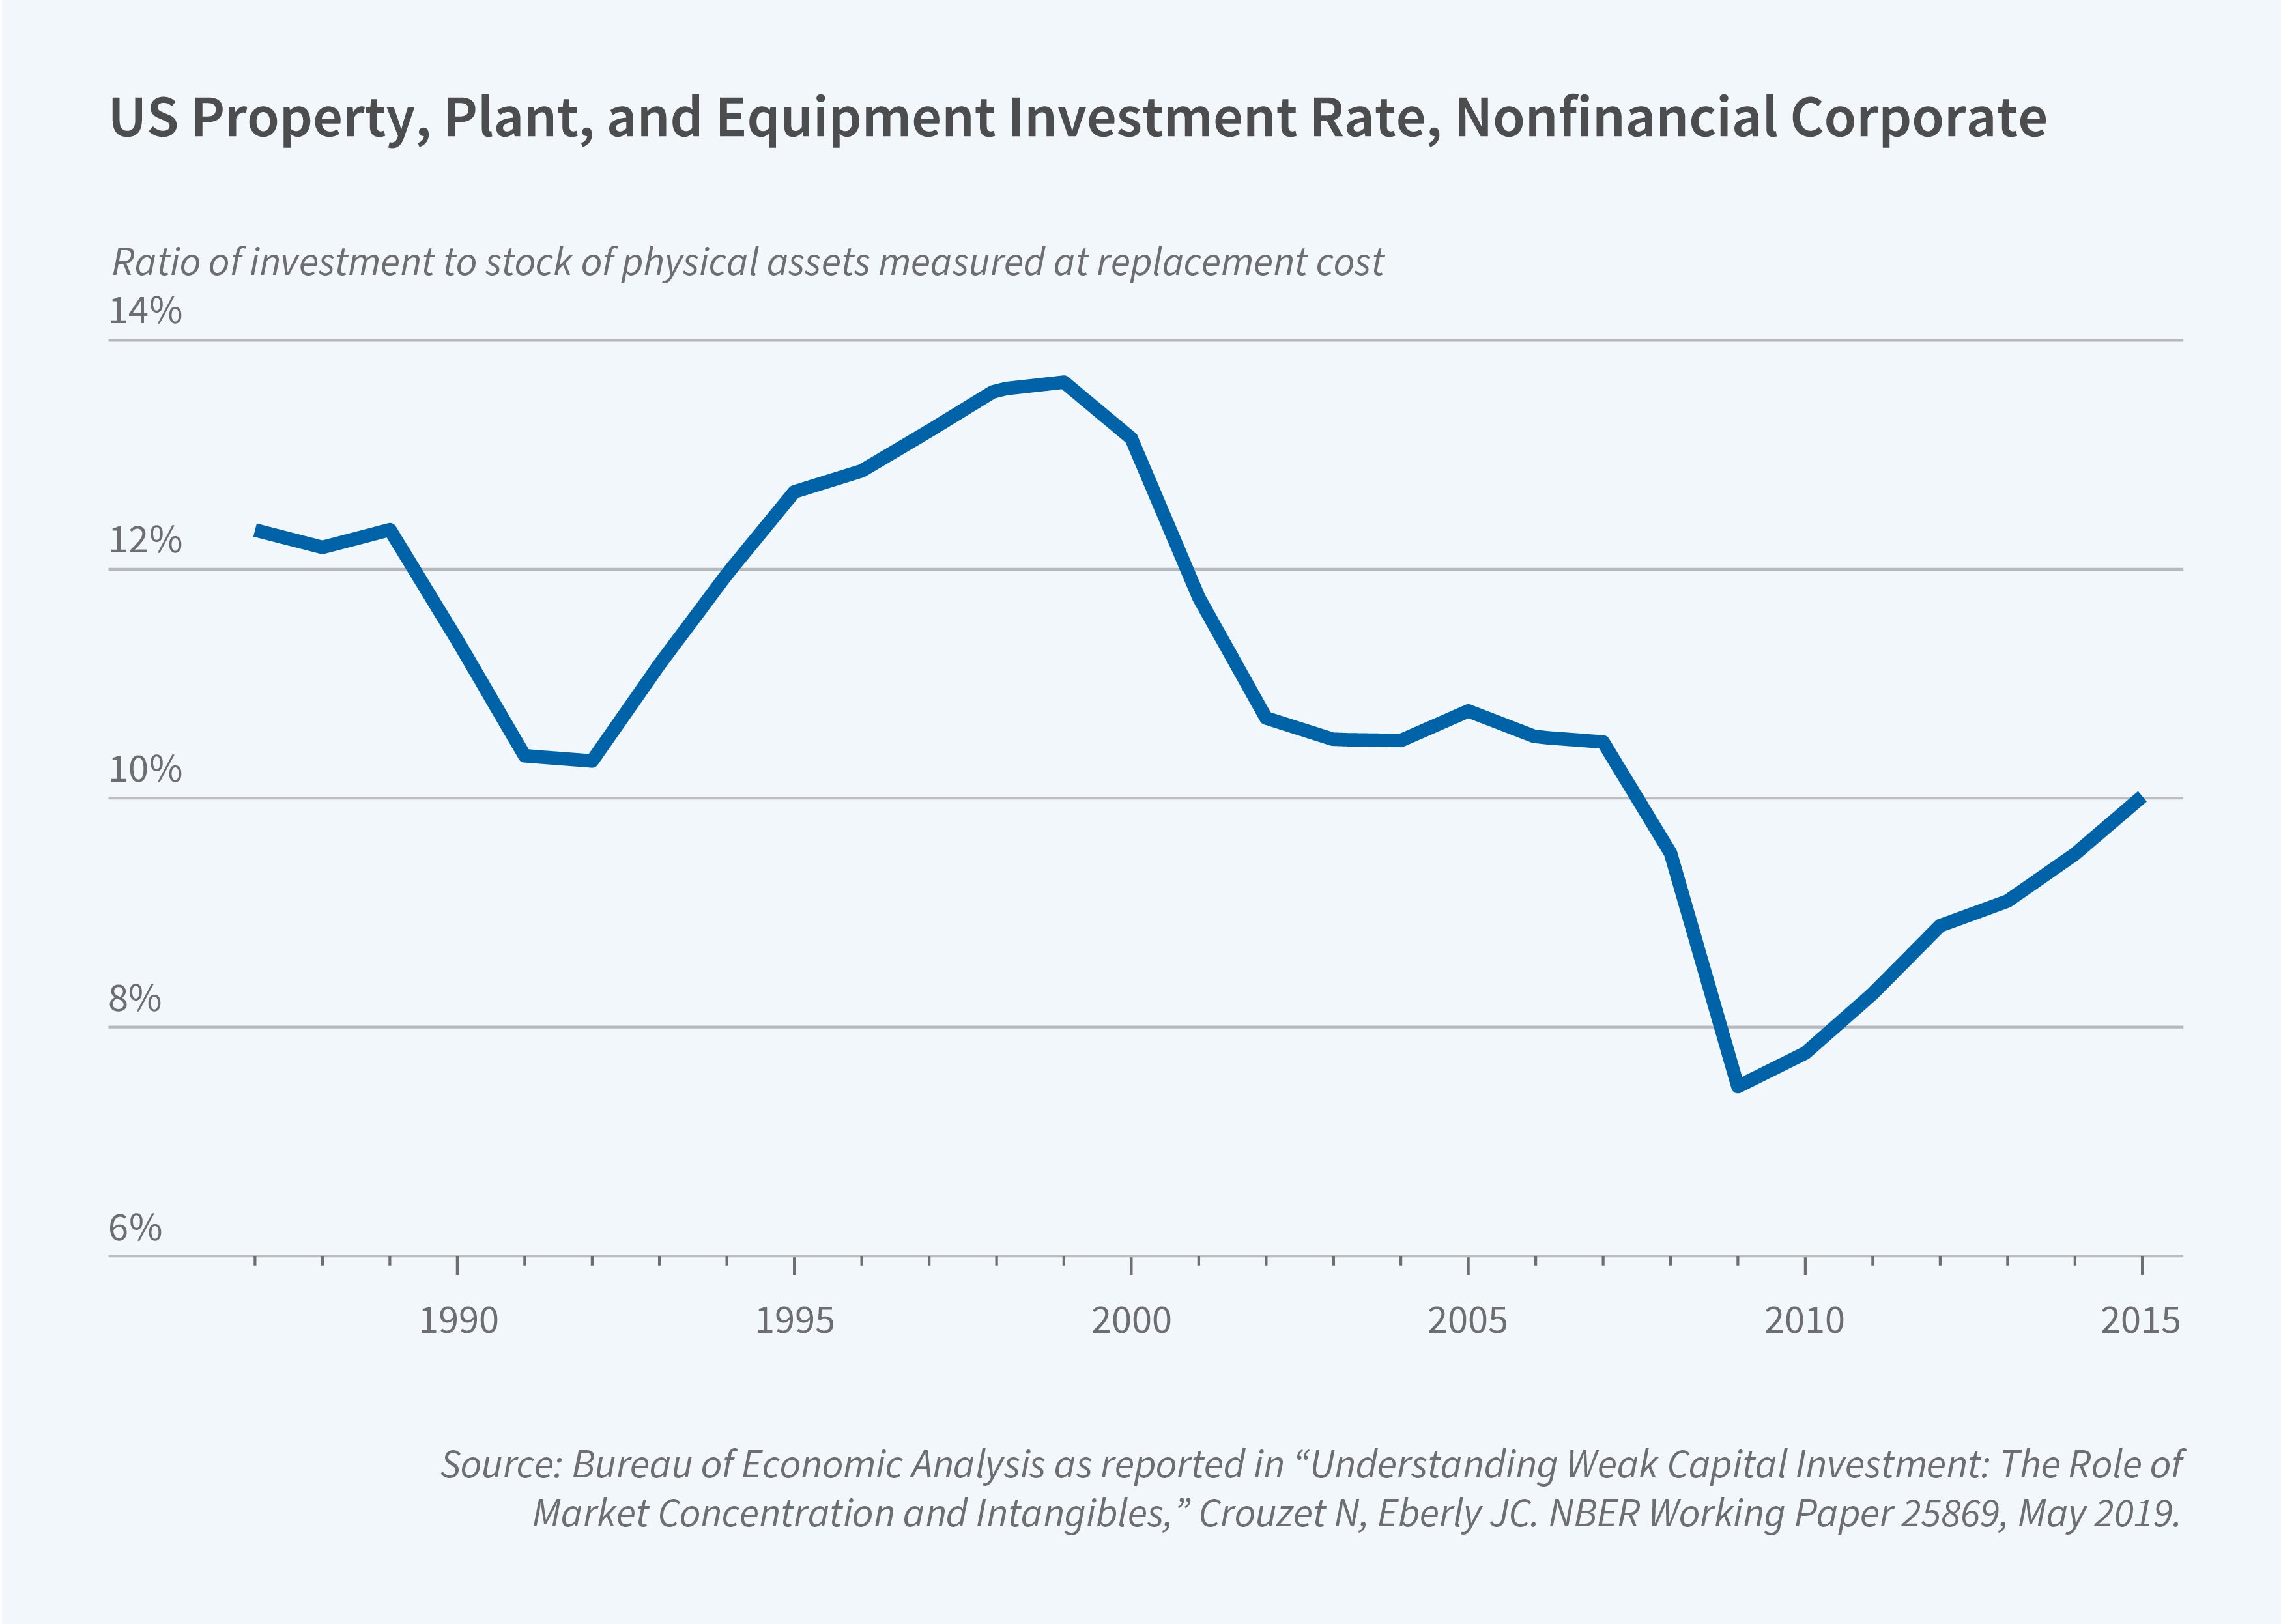
How do we reconcile the data with the theory? Nicolas Crouzet and Janice Eberly put forth an elegant framework that adds two key elements to the classic Hayashi model: Firms may earn pure economic profits and firms may use intangible capital in production.6 Distinguishing which of these two elements is at work is crucial given that they have different implications for the efficiency of firm production, a point made in Gutiérrez and Philippon’s research. Crouzet and Eberly calibrate their model to aggregate measures of investment from the Bureau of Economic Analysis and conclude that economic profits from physical capital are important, but that the change over time is driven more by the rise in intangible capital.
Given the importance of intangible capital, measurement becomes an important endeavor. The classic approach in the finance literature follows Andrea Eisfeldt and Dimitris Papanikolaou, who measure intangible capital by adding externally acquired intangible capital to the capitalized value of R&D expenses and a fraction of selling, general, and administrative (SG&A) expenses.7 Ryan Peters and Lucian Taylor use this measure of intangible capital to explore the determinants of investment.8 A large body of research measures intangible capital using patents issued to firms, following the research by Leonid Kogan, Papanikolaou, Amit Seru, and Noah Stoffman.9 Michael Ewens, Peters, and Sean Wang utilize data from acquisitions in which firms must disclose the value of the assets they are purchasing (called a “purchase price allocation”).10
Corporate finance scholarship increasingly focuses on testing these alternative channels of value creation. For example, regarding the role of R&D, Tania Babina and Sabrina Howell show how R&D at one firm leads employees to join the founding teams at related startups.11 Research by Xavier Giroud, Simone Lenzu, Quinn Maingi, and Holger Mueller focuses on how local productivity gains are passed on to other regions through the production networks of firms.12 Song Ma, Joy Tianjiao Tong, and Wei Wang show how bankruptcy lowers the value of important patents at innovative firms, suggesting that costs of financial distress can ultimately lower the social value of business innovation.13 Similarly, several studies analyze the importance of labor practices for value creation, in particular rent sharing with workers as in the research by Elio Nimier-David, David Sraer, and David Thesmar, or labor representation on the board as in the research by Simon Jäger, Benjamin Schoefer, and Jörg Heining.14
Corporate Governance and ESG Policies
A major area of inquiry for corporate finance scholarship is the effect of corporate governance on firm behavior and the efficient allocation of capital. Traditionally, scholars viewed the central role of governance as ensuring investors’ return on their investment. However, it is now widely accepted that financiers may have additional objectives they seek to implement through the financing they provide firms, as pointed out by Laura Starks.15 Oliver Hart and Luigi Zingales call this “The New Corporate Governance,” and they point out that “there has been a dramatic increase in shareholder engagement on environmental and social issues.”16
Whether ESG-related preferences of financiers, or environmental concerns in particular, have real effects on firm outcomes such as pollution remains an open question. Firms may engage in “greenwashing”: marketing themselves as environmental warriors while making few if any changes in their policies. The ESG metrics used by financiers may be easy to manipulate or might be used to justify poor financial performance on more traditional metrics. There may be significant “leakage” if other financiers who care less about ESG-related goals simply replace those who care more.
The evidence from the literature thus far is mixed. Several recent studies argue that green policies or investor mandates can change the cost of capital for green firms — for example, see research by Sudheer Chava or Lubos Pastor, Robert Stambaugh, and Taylor.17 But showing a real impact for firm operations or pollution levels has proved difficult. Jonathan Berk and Jules van Binsbergen, for example, do not find significant effects from ESG-motivated equity divestment on targeted firms’ cost of capital and real investment decisions.18 Parinitha Sastry, Emil Verner, and David Marques Ibanez focus on credit registry data from Europe to evaluate bank net zero commitments, or commitments to “align lending and investment portfolios with net-zero emissions by 2050.”19 They do not find any evidence that banks signing net-zero pledges are more likely to divest from polluting sectors or to exert pressure on the firms to which they lend to reduce carbon emissions. They conclude that their findings “highlight the limits of voluntary commitments for decarbonization.”
Similarly, a recent paper by Daniel Green and Boris Vallee conducts a detailed industry study of bank policies to voluntarily cease financing coal-related firms.20 The authors measure cross-sectional variation across banks in coal-exit policies, showing that banks that adopted such exit policies were previously providing 60 percent of the coal industry’s debt financing. Coal companies that were borrowing from banks that adopted such voluntary exit policies saw a substantial decline in the available supply of capital and a contraction in their total assets. But the paper also highlights the difficulty of isolating the direction of causality for the observed outcomes. Banks’ decisions to voluntarily target lending to coal producers might depend not only on the ”green” objectives of their investors but also on expected changes in the regulatory environment that penalize “brown” firms — those that engage in activities that are more harmful to the environment. Banks might therefore be reacting to financial incentives rather than green preferences.
This discussion highlights the importance of understanding the context in which firms and investors are implementing ESG policies. An interesting study by Ran Duchin, Janet Gao, and Qiping Xu presents a cautionary tale and shows the limits of environmental pressures at the individual firm level.21 Their analysis focuses on a broad sample of industrial plants that produce toxic chemicals as defined by the Environmental Protection Agency. It shows that firms targeted by investors, ESG rating agencies, policymakers, and the public at large are more likely to divest pollution-emitting plants. However, these plants are typically bought by firms that face less pressure from such groups. Ultimately, the evidence suggests that there is no net decline in pollution when these divestitures take place. The authors conclude that “firms respond to environmental pressures through a greenwashing divestment strategy.” The results also provide evidence for the difficulty of implementing effective ESG policies at the individual firm level.
Several other studies build on the idea that the real effects of investor pressure depend on the broader regulatory and legislative context. Pat Akey and Ian Appel analyze how changes in the enforcement of limited liability in the case of environmental damages affect firms’ incentives to invest in environmental protections and cleanup.22 Using a difference-in-differences framework, they find that stronger liability protection for parent firms leads to a 5–9 percent increase in toxic emissions by subsidiaries.
Samuel Hartzmark and Kelly Shue show that policies that reduce financing availability to “brown firms” can have unintended consequences in making them “browner” if the increased cost of financing reduces their ability to invest in greener or more modern technologies.23 The authors also argue that some widely used definitions of “environmental impact” may direct capital to firms with a very low carbon footprint and for which a lower cost of capital will not measurably improve environmental outcomes.
Martin Oehmke and Marcus Opp analyze bank capital requirements as a tool to address externalities caused by carbon emissions.24 They show that there can be built-in tension if higher capital requirements for carbon-intensive loans crowd out clean lending. Reducing emissions via capital requirements may negatively affect financial stability or may be infeasible. They point out that achieving environmental objectives via carbon taxes would not have these effects.
Going forward, there is a question of how the “demand” for environmental objectives will evolve. A recent study by Malcolm Baker, Mark Egan, and Suproteem Sarkar suggests that demand for ESG-oriented index funds in the United States fell considerably from 2020 to 2023, even though demand remains strong in Europe.25
Banks and Interest Rate Risk: Lessons from the Recent Fed Tightening Cycle
Banking and financial intermediation continue to be core areas of research in corporate finance. In recent years, changes in the monetary policy environment have prompted research on banks’ exposure to interest rate risk. Does the value of the banking sector fall when interest rates rise? Does a rise in interest rates lead to bank failures? Do changes in monetary policy threaten financial stability?
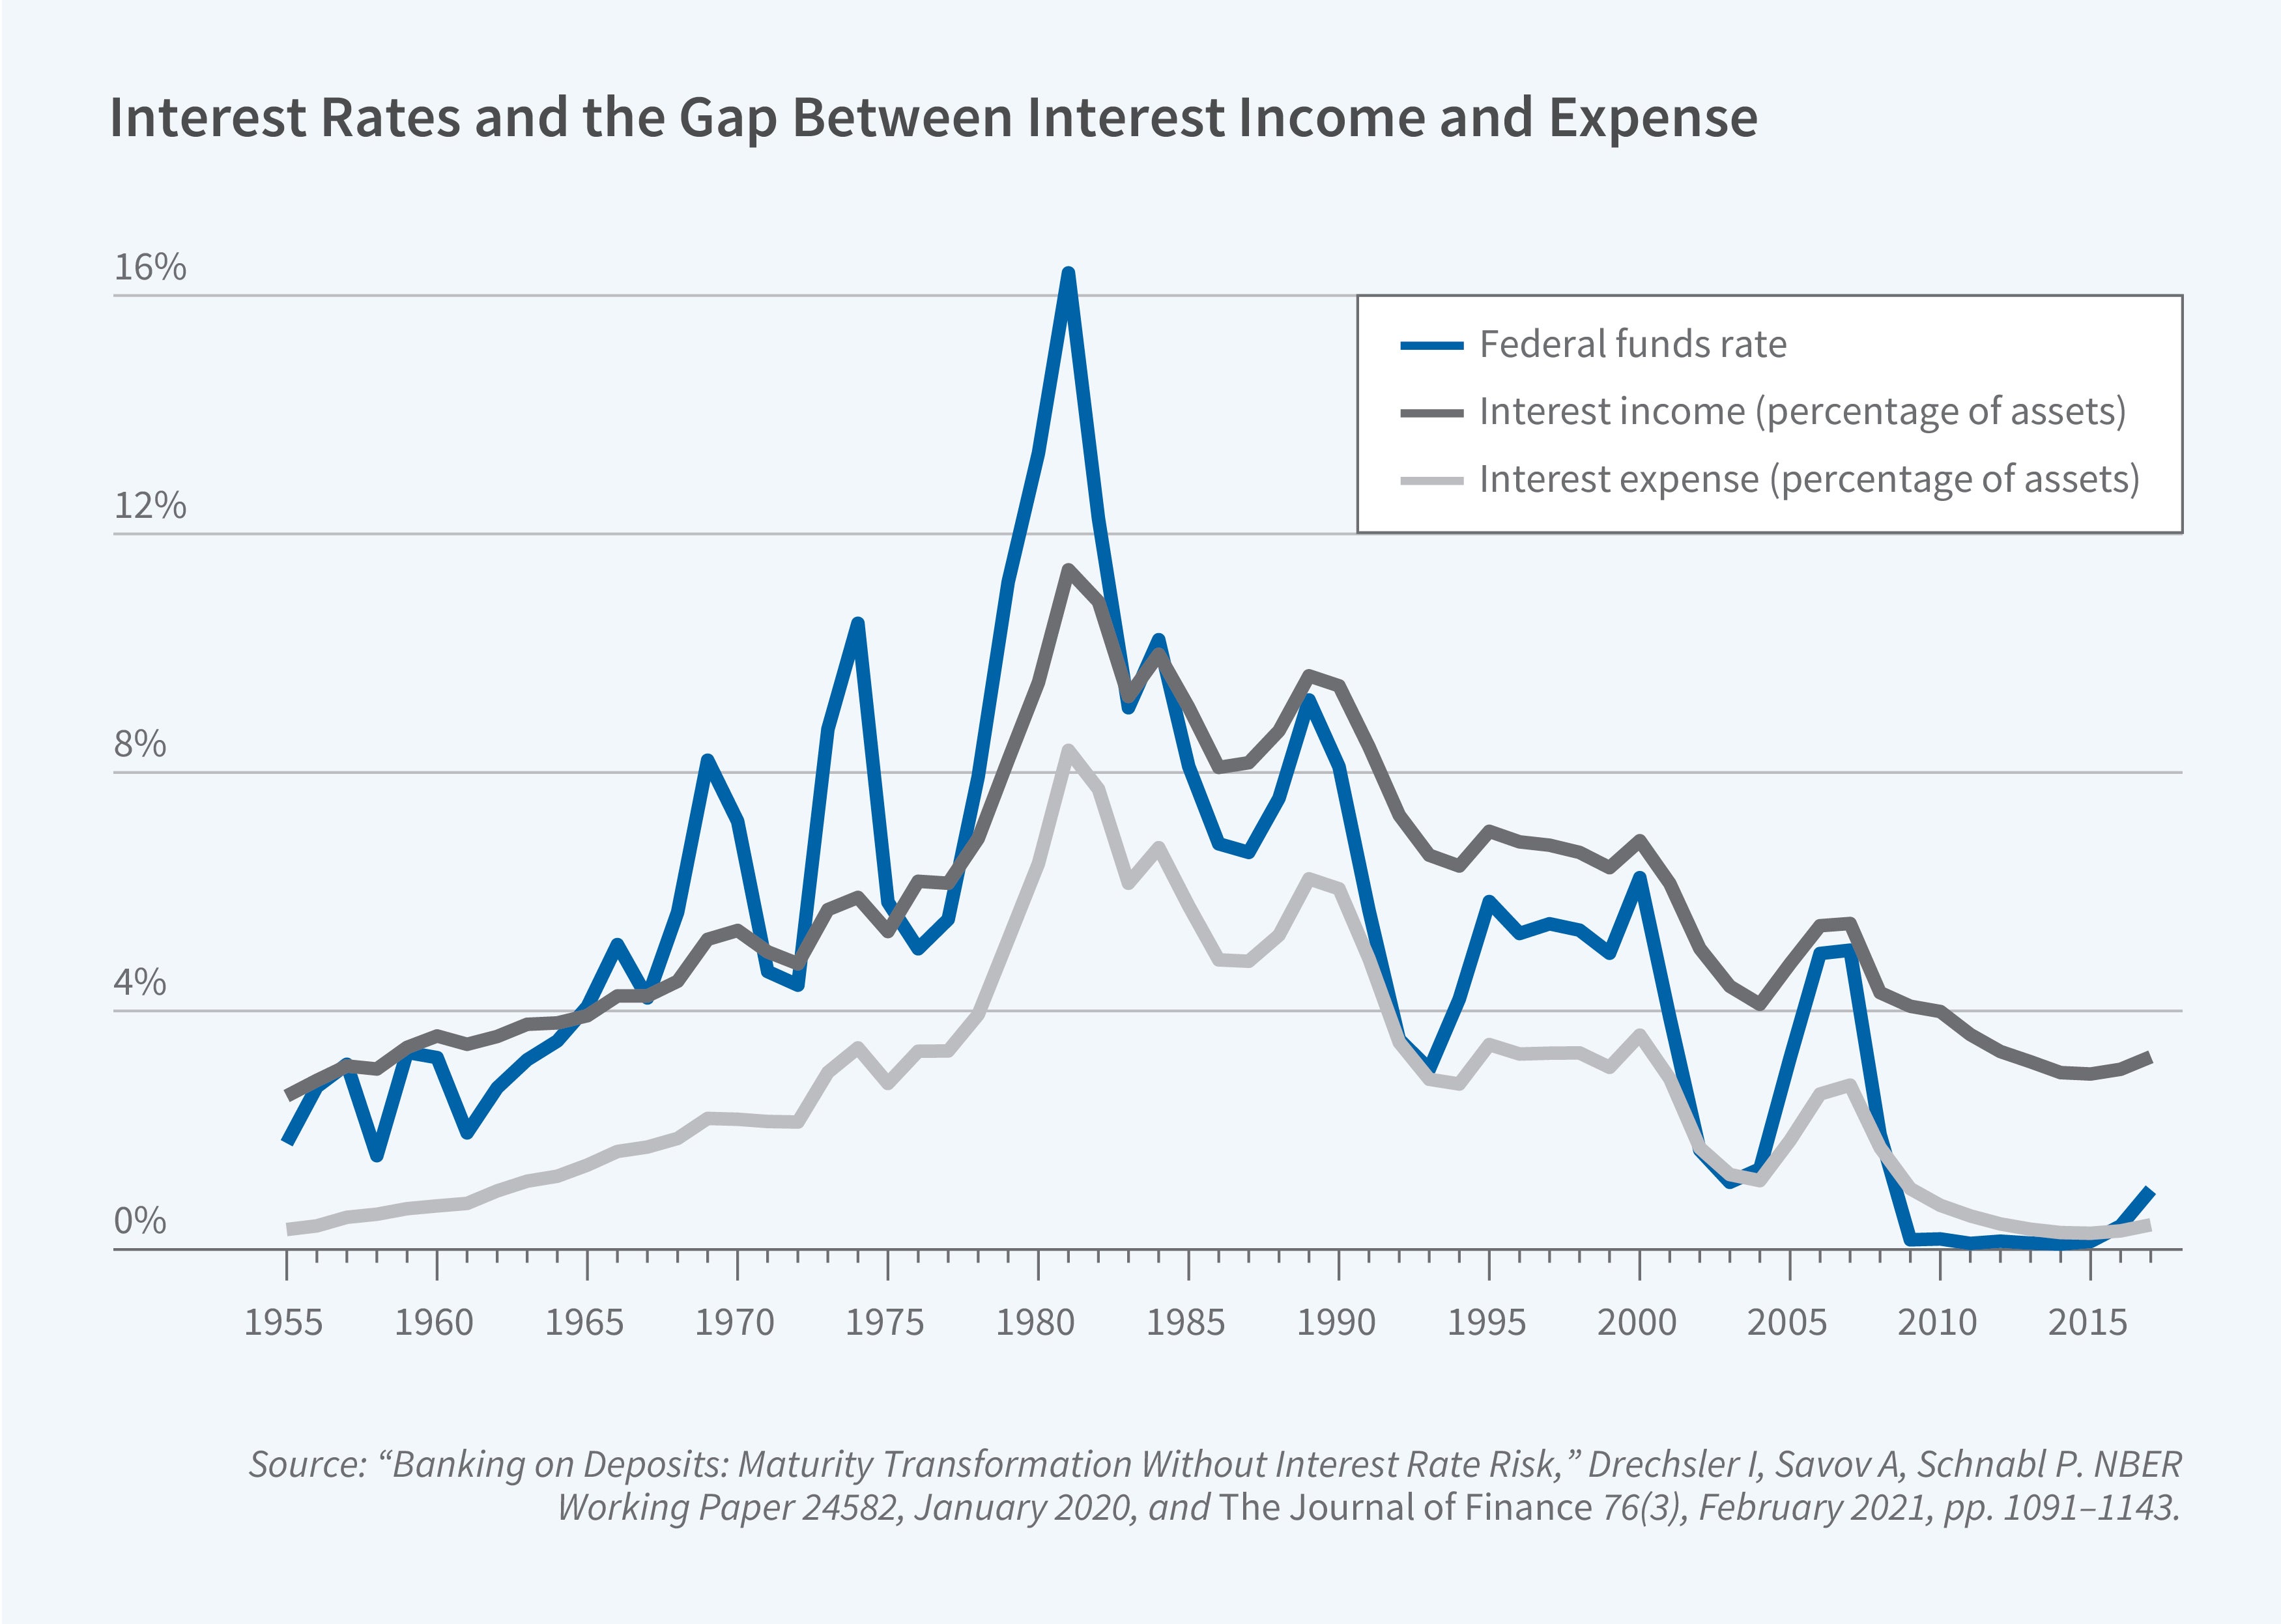
There have been major advancements in the understanding of the interest rate risk of banking. A starting point of the recent research is the influential contribution of Itamar Drechsler, Alexi Savov, and Philipp Schnabl, who argue that banks have a “deposit franchise” because they can pay interest rates on deposits that are lower than market-wide interest rates.26 Moreover, the gap between market interest rates and the deposit rates paid by banks, what the authors call the “deposit spread,” increases as interest rates rise.
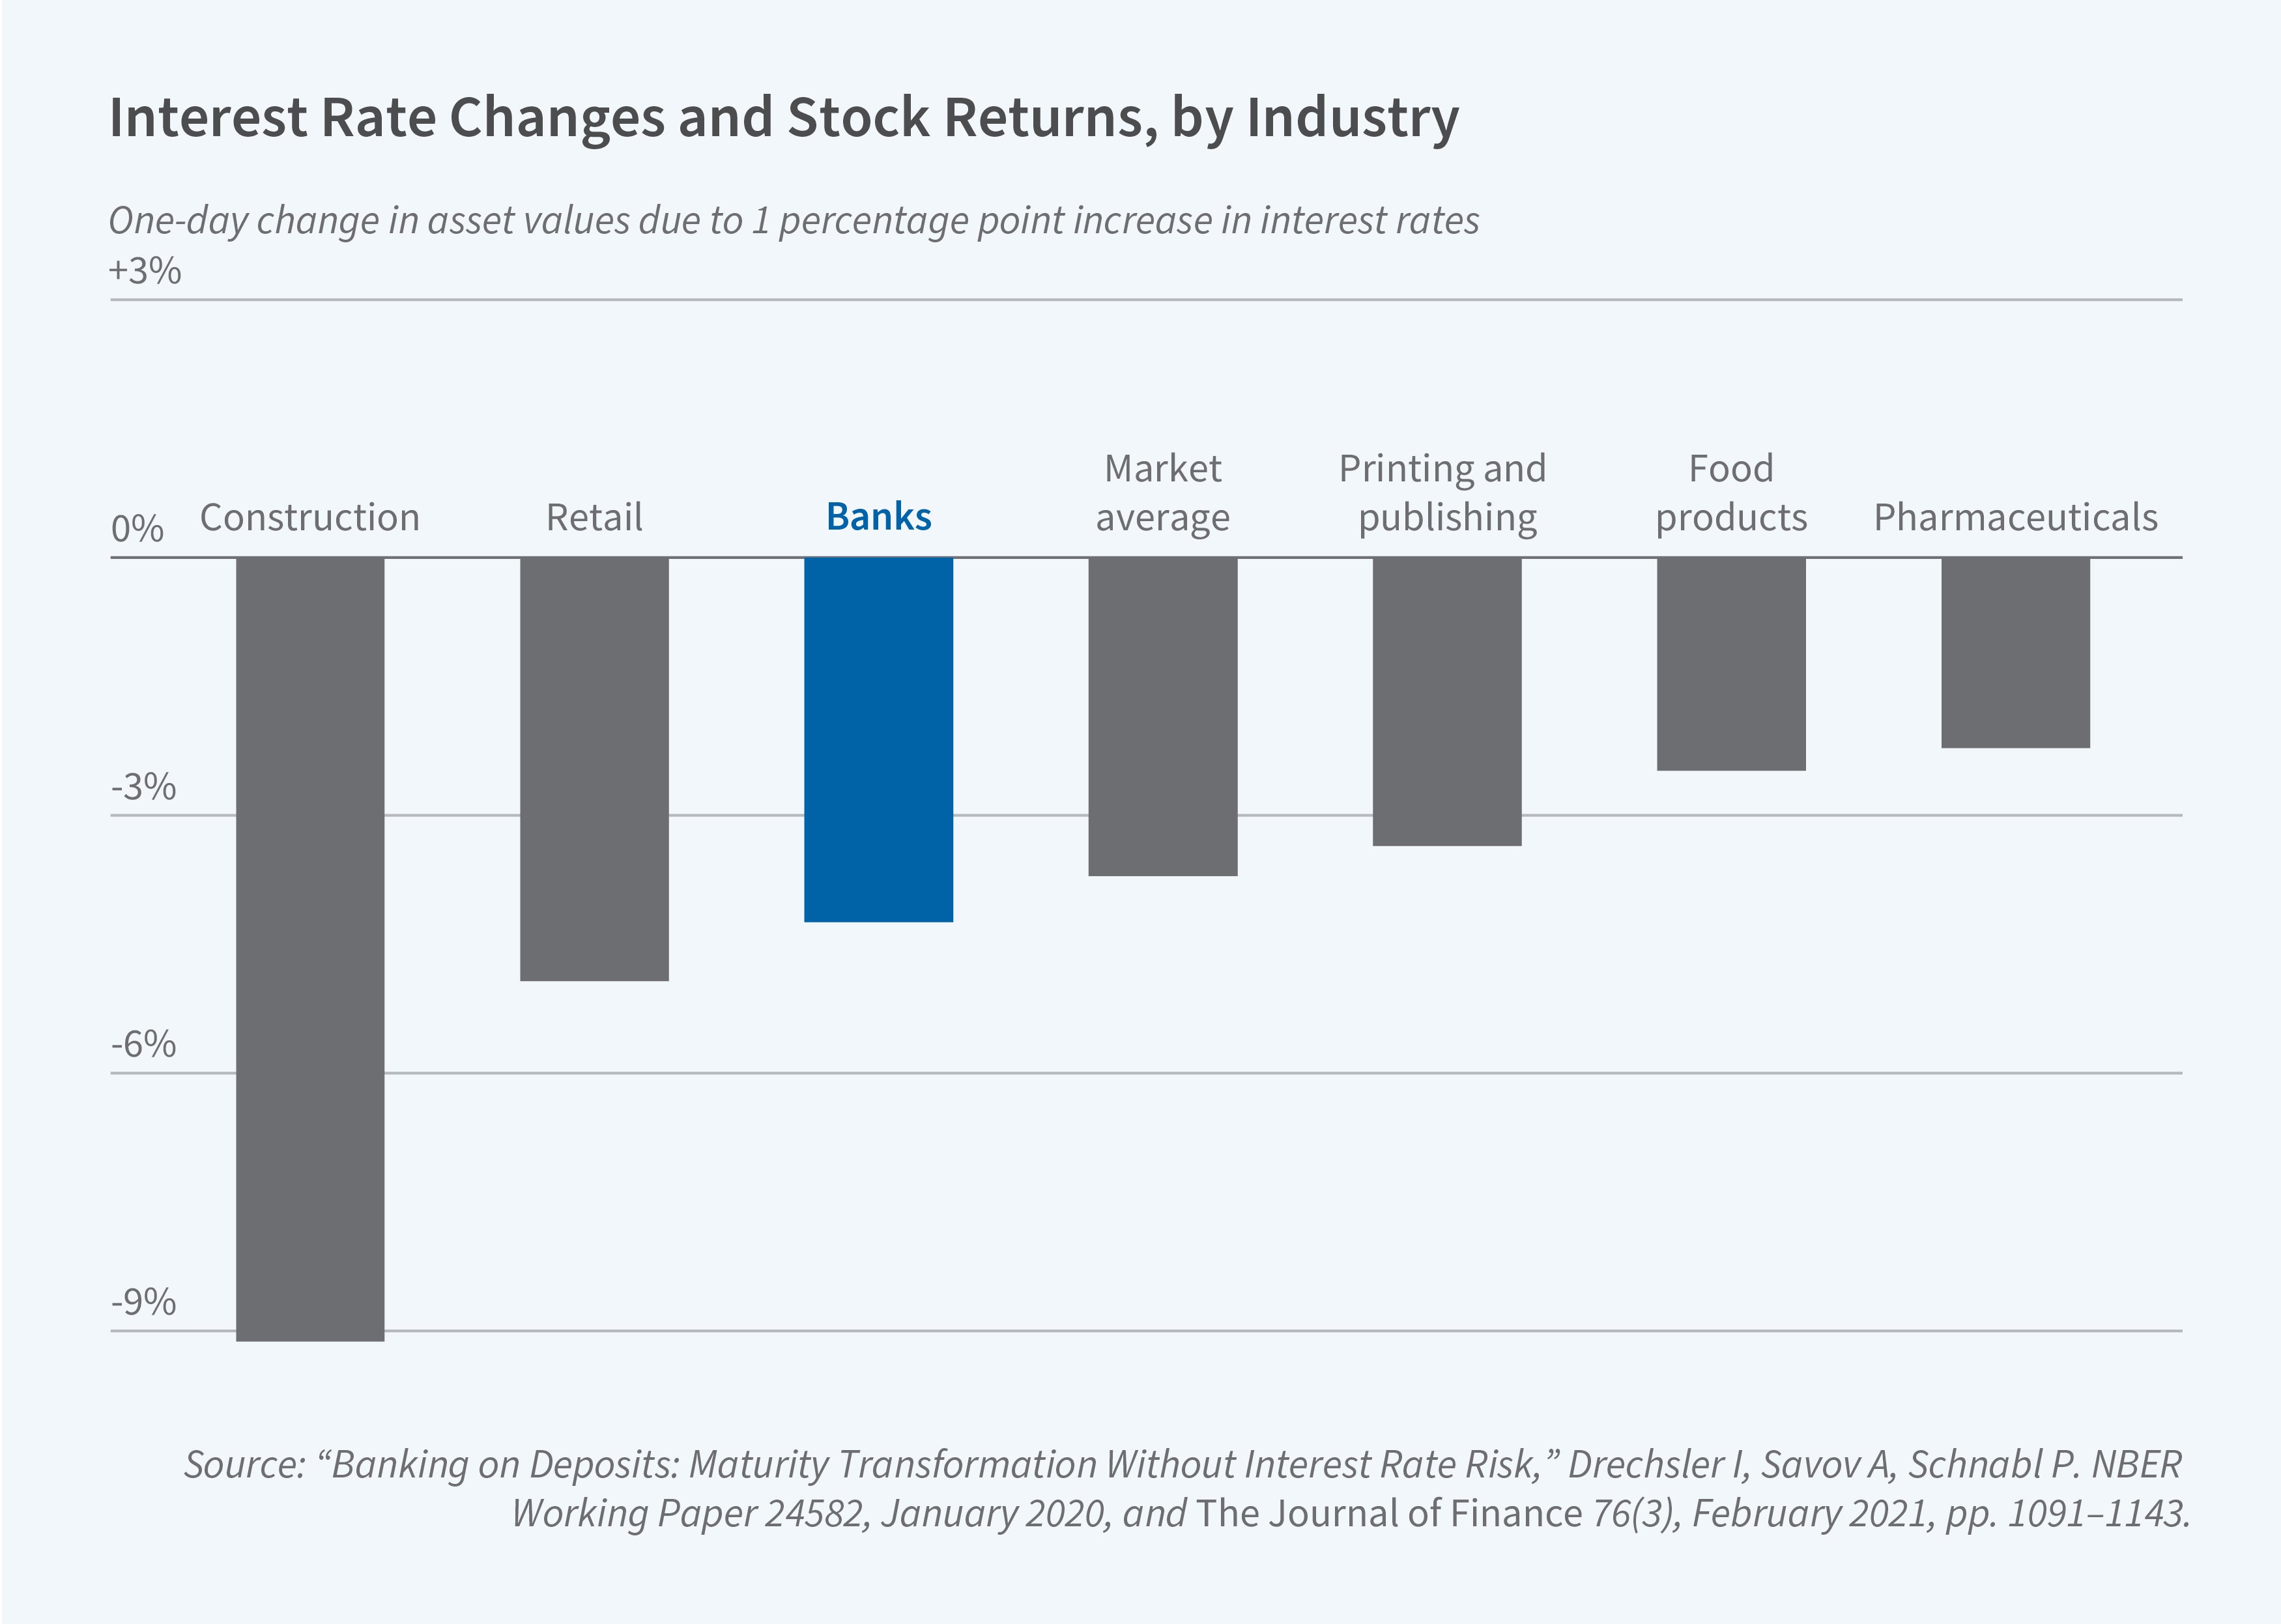
In a follow-on study, the same authors examine how the existence of the deposit franchise affects banks’ exposure to a rise in interest rates. Banks’ total cash flows appear to be much less exposed to a rise in interest rates than previously believed because the deposit spread rises with interest rates.27 This leads to a significant rise in interest income when rates rise. Furthermore, because banks have fixed operating costs associated with the maintenance of the deposit franchise, a rise in interest rates can be positive for the value of the deposit franchise, as the present value of the future fixed operating costs declines. Consistent with these arguments, the study shows that the gap between interest income and interest expense is insensitive to changes in short-term interest rates [Figure 3], and that banks’ one-day stock market response to an FOMC-announced increase in interest rates is similar in magnitude to the average response among all firms in the economy [Figure 4].
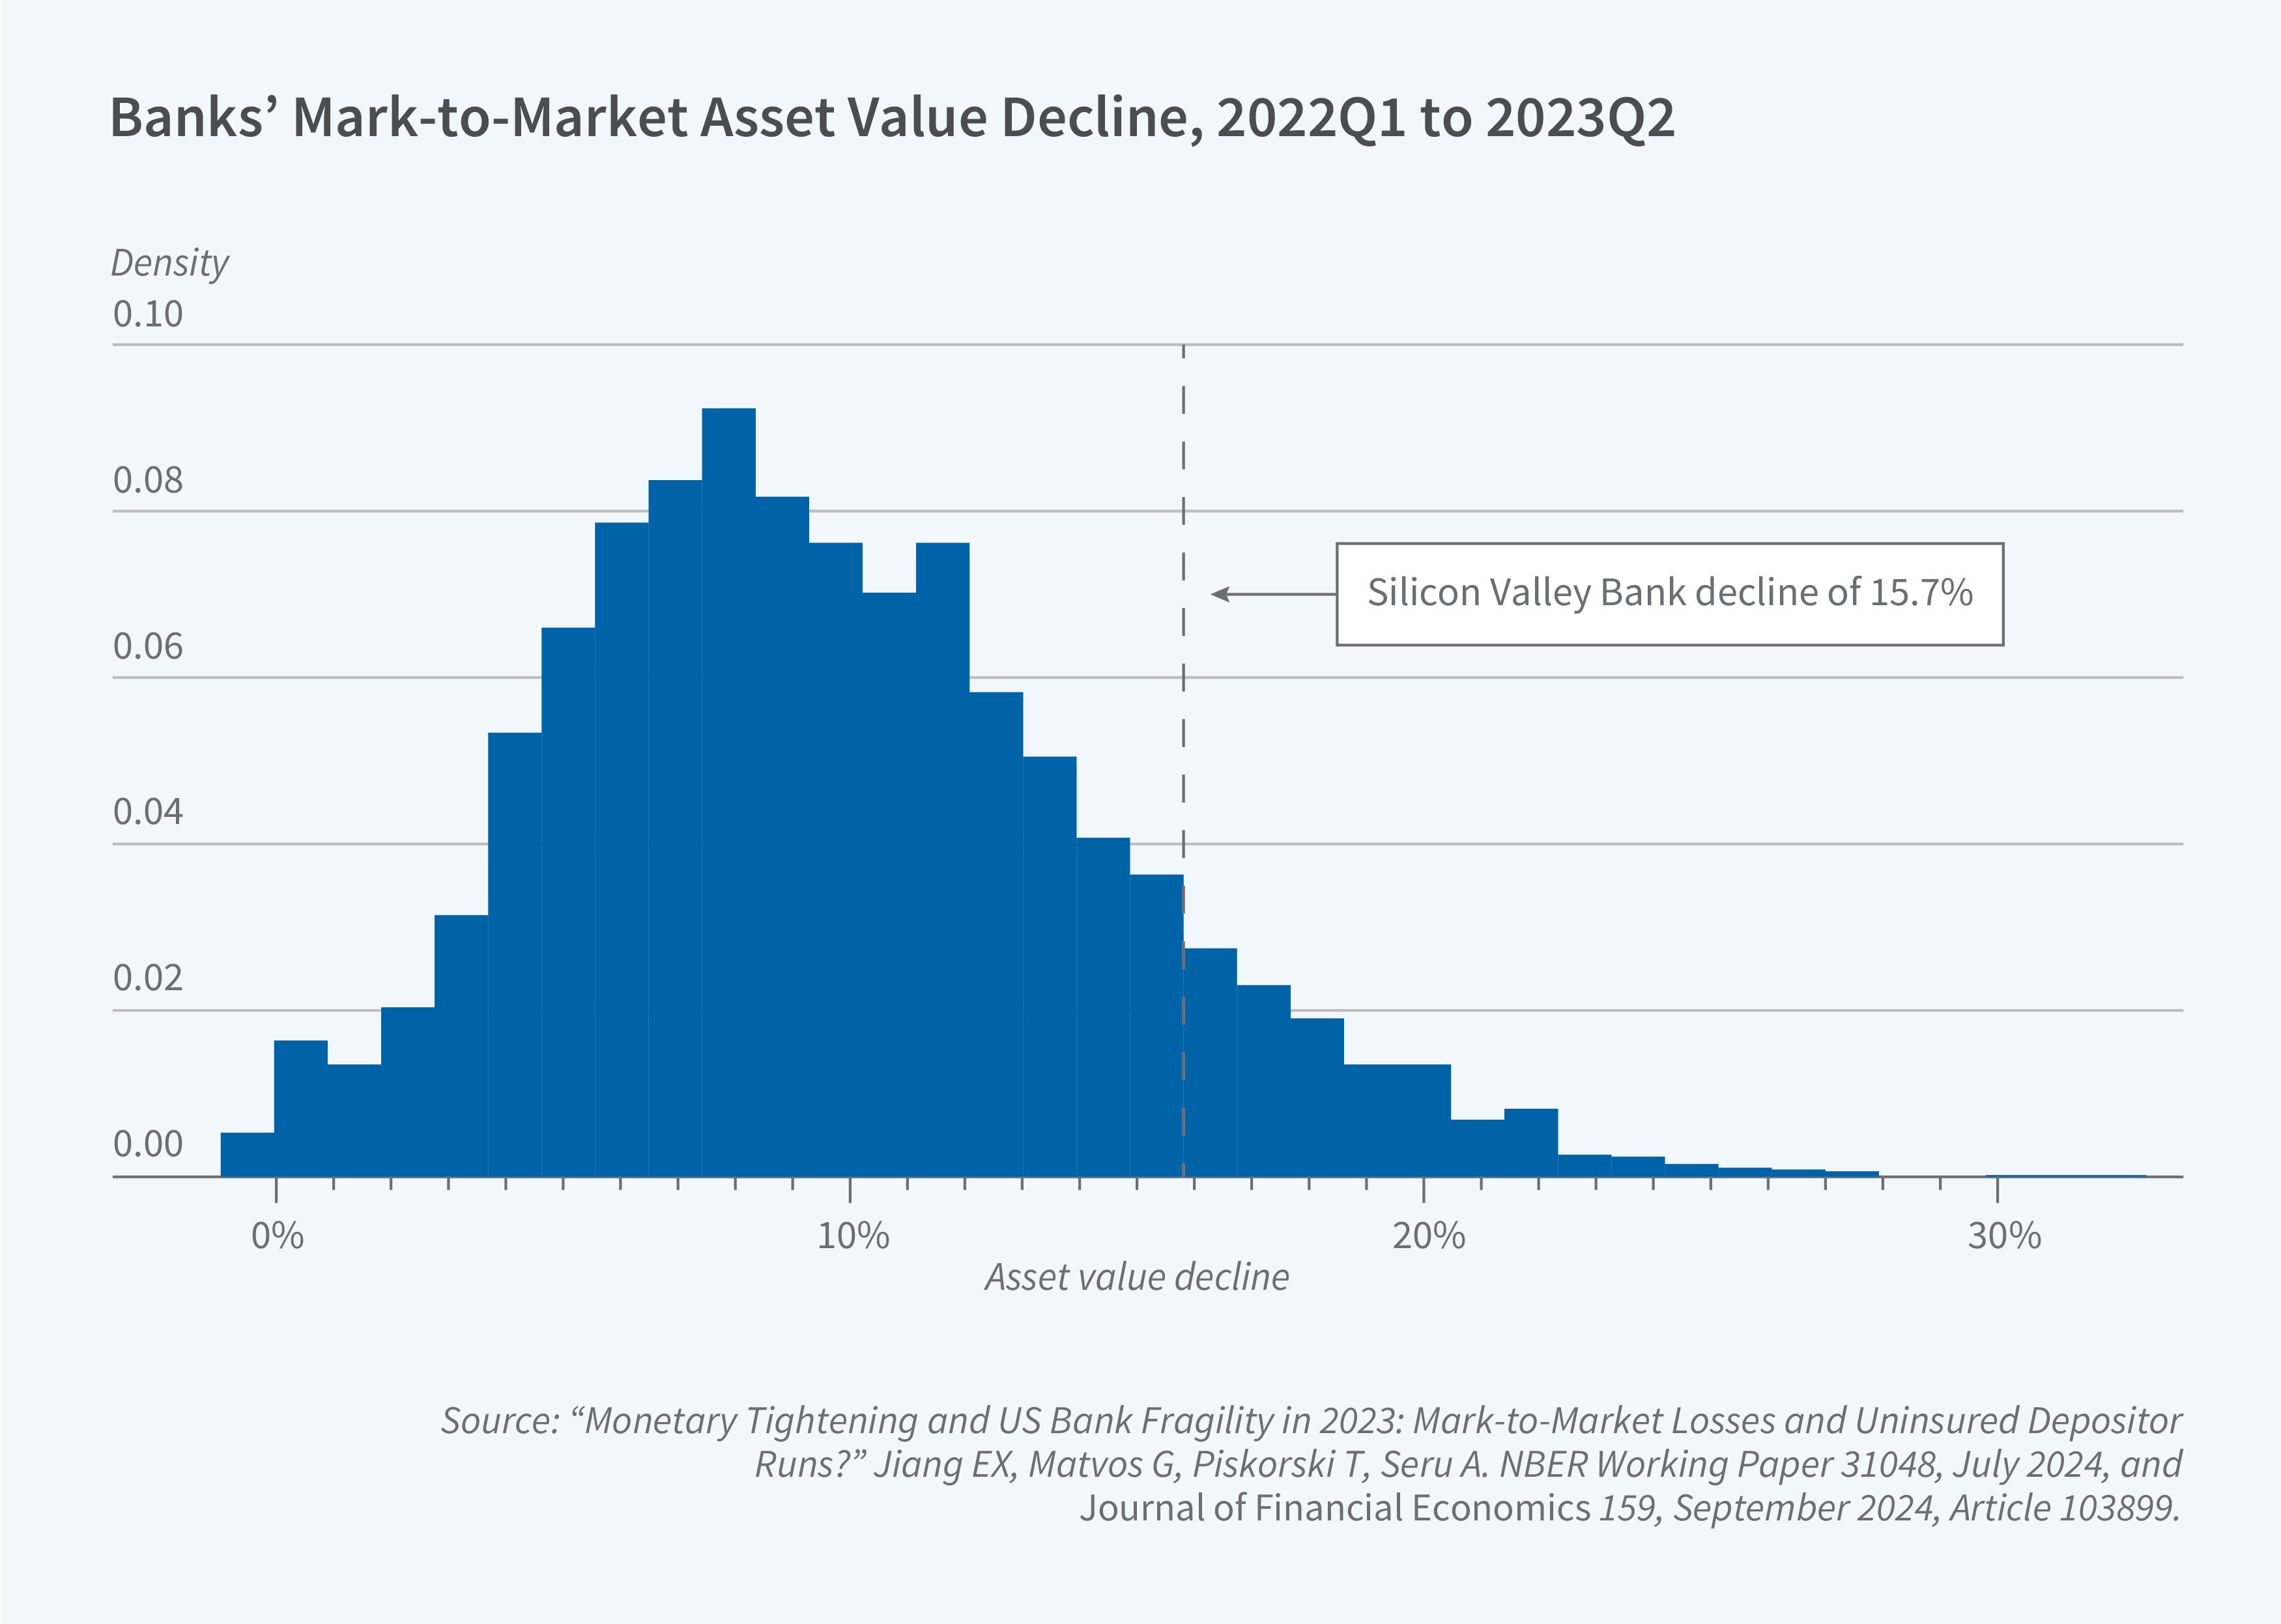
However, a rise in interest rates may threaten bank value if it induces a bank run. The recent turmoil in the banking sector, as illustrated by the failure of Silicon Valley Bank (SVB), has inspired research on this question. Erica Jiang, Gregor Matvos, Tomasz Piskorski, and Seru develop a model in which a rise in interest rates may induce a self-fulfilling run by depositors even if the underlying assets are liquid.28 They observe that any given depositor will not panic as long as the value of the bank overall is high enough to cover their deposit even if other depositors suddenly withdraw. However, if the value of the bank falls enough that a given depositor loses money if other depositors withdraw, then the depositor may also withdraw. A sudden drop in the value of the bank can therefore induce a self-fulfilling solvency run even if the assets of the bank are liquid. A sudden rise in interest rates could lower the value of the bank enough to push it into this self-fulfilling solvency run region.
The authors empirically examine the 2023 SVB episode and estimate the decline in value of the US banking system’s securities portfolio between the first quarter of 2022 and the first quarter of 2023. They focus on securities that are not marked to market, which account for unrealized losses on bank balance sheets. The total decline in asset value from unrealized losses is estimated to be $2.2 trillion. For the median bank, the loss was 9 percent of asset value. The total losses are on the same order of magnitude as aggregate bank equity. However, the authors argue that the losses alone cannot explain bank failures during the turmoil. For example, SVB was not an outlier in terms of the losses on its securities portfolio, nor was it an outlier in having a low equity-to-assets ratio [Figure 5]. It was an outlier because its assets were financed to a large degree by uninsured deposits. It is the combination of a decline in value and more “runnable” deposits that raises the probability of a bank run, consistent with the self-fulfilling solvency run concept.
How bank values change with a change in interest rates is fundamental to our understanding of financial intermediation; it therefore is an active area of ongoing research. Peter DeMarzo, Arvind Krishnamurthy, and Stefan Nagel confirm the finding that banks’ cash flows are relatively insensitive to changes in interest rates given the deposit franchise.29 However, their study argues that the value of banks is more negatively exposed to a rise in interest rates than suggested by the Drechsler, Savov, and Schnabl framework. The key difference is that the DeMarzo et al. study argues that banks also have a fixed spread that they earn on their lending activity. A rise in interest rates reduces the present value of expected lending spreads, offsetting the increase in value coming from the decline in the present value of fixed operating costs of the deposit franchise. This exciting area of research will certainly attract more interest going forward.
Endnotes
“Valuation Fundamentals,” Décaire PH, Graham JR. HKU Jockey Club Enterprise Sustainability Global Research Institute, September 2024.
“Corporate Discount Rates,” Gormsen NJ, Huber K. NBER Working Paper 31329, June 2024.
“Modeling Managers As EPS Maximizers,” Ben-David I, Chinco AM. NBER Working Paper 31125, June 2023.
“Investment-less Growth: An Empirical Investigation,” Gutiérrez G, Philippon T. NBER Working Paper 22897, January 2017.
“Tobin’s Marginal q and Average q: A Neoclassical Interpretation,” Hayashi F. Econometrica 50(1), January 1982, pp. 213–224.
“Rents and Intangible Capital: A Q+ Framework,” Crouzet N, Eberly JC. NBER Working Paper 28988, July 2021, and The Journal of Finance 78(4), April 2023, pp. 1873–1916.
“Organization Capital and the Cross-Section of Expected Returns,” Eisfeldt AL, Papanikolaou D. The Journal of Finance 68(4), August 2013, pp. 1365–1406.
“Intangible Capital and the Investment-q Relation,” Peters RH, Taylor LA. Journal of Financial Economics 123(2), February 2017, pp. 251–272.
“Technological Innovation, Resource Allocation, and Growth,” Kogan L, Papanikolaou D, Seru A, Stoffman N. NBER Working Paper 17769, May 2016, and The Quarterly Journal of Economics 132(2), May 2017, pp. 665–712.
“Measuring Intangible Capital with Market Prices,” Ewens M, Peters RH, Wang S. NBER Working Paper 25960, October 2023.
“Entrepreneurial Spillovers from Corporate R&D,” Babina T, Howell ST. NBER Working Paper 25360, July 2019, and Journal of Labor Economics 42(2), April 2024, pp. 469–509.
“Propagation and Amplification of Local Productivity Spillovers,” Giroud X, Lenzu S, Maingi Q, Mueller H. NBER Working Paper 29084, July 2021.
“Bankrupt Innovative Firms,” Ma S, Tong JT, Wang W. NBER Working Paper 28856, May 2021, and Management Science 68(9), November 2021, pp. 6355–7064.
“The Effects of Mandatory Profit-Sharing on Workers and Firms: Evidence from France,” Nimier-David E, Sraer D, Thesmar D. NBER Working Paper 31804, October 2023.
“Labor in the Boardroom,” Jäger S, Schoefer B, Heining J. NBER Working Paper 26519, August 2020, and The Quarterly Journal of Economics 136(2), October 2020, pp. 669–725.
“Presidential Address: Sustainable Finance and ESG Issues—Value versus Values,” Starks LT. The Journal of Finance 78(4), August 2023, pp. 1837–1872.
“The New Corporate Governance,” Hart OD, Zingales L. NBER Working Paper 29975, April 2022.
“Environmental Externalities and Cost of Capital,” Chava S. Management Science 60(9), September 2014, pp. 2223–2247.
“Dissecting Green Returns,” Pastor L, Stambaugh RF, Taylor LA. NBER Working Paper 28940, June 2022, and Journal of Financial Economics 146(2), November 2022, pp. 403–424.
“The Impact of Impact Investing,” Berk JB, van Binsbergen JH. Journal of Financial Economics 164, February 2025, Article 103972.
Net Zero Banking Alliance via “Business as Usual: Bank Net Zero Commitments, Lending, and Engagement,” Sastry PR, Verner E, Marques Ibanez D. NBER Working Paper 32402, May 2024.
“Measurement and Effects of Bank Exit Policies,” Green D, Vallee B. Proceedings of the EUROFIDAI-ESSEC Paris December Finance Meeting, November 2024.
“Sustainability or Greenwashing: Evidence from the Asset Market for Industrial Pollution,” Duchin R, Gao J, Xu Q. The Journal of Finance, December 2024.
“The Limits of Limited Liability: Evidence from Industrial Pollution,” Akey P, Appel I. The Journal of Finance 76(1), September 2020, pp. 5–55.
“Counterproductive Sustainable Investing: The Impact Elasticity of Brown and Green Firms,” Hartzmark SM, Shue K. October 2024.
“Green Capital Requirements,” Oehmke M, Opp M. ECB Banking Supervision, February 2023.
“Demand for ESG,” Baker M, Egan ML, Sarkar SK. NBER Working Paper 30708, December 2024.
“The Deposits Channel of Monetary Policy,” Drechsler I, Savov A, Schnabl P. NBER Working Paper 22152, January 2017, and The Quarterly Journal of Economics 132(4), November 2017, pp. 1819–1876.
“Banking on Deposits: Maturity Transformation Without Interest Rate Risk,” Drechsler I, Savov A, Schnabl P. NBER Working Paper 24582, January 2020, and The Journal of Finance 76(3), June 2021, pp. 1091–1143.
“Deposit Franchise Runs,” Drechsler I, Savov A, Schnabl P, Wang O. NBER Working Paper 31138, September 2024.
“Monetary Tightening and US Bank Fragility in 2023: Mark-to-Market Losses and Uninsured Depositor Runs?” Jiang EX, Matvos G, Piskorski T, Seru A. NBER Working Paper 31048, July 2024, and Journal of Financial Economics 159, September 2024, Article 103899.
“Interest Rate Risk in Banking,” DeMarzo PM, Krishnamurthy A, Nagel S. NBER Working Paper 33308, December 2024.


