What Drives Fluctuations in Exchange Rates? An Asset Market Perspective
From an asset market perspective, there are three main drivers of variation in the dollar exchange rate. First, foreign investors value dollars more if dollar investments pay out higher interest rates than abroad. This is the interest rate channel. Second, foreign investors value dollars more if the dollar appreciates when volatility in global financial markets spikes. In this case, the dollar offers protection against increases in global volatility, and foreign investors are willing to accept a negative excess return on dollar assets, the equivalent of paying an insurance premium to hold the dollar. This is the currency risk premium channel. Third, foreign investors value dollars because of the safety and liquidity of dollar-denominated safe assets, such as Treasury bonds. Foreign investors earn extra convenience yields from holding these dollar-denominated safe assets instead of domestic safe assets. This is the convenience yield channel.
The dollar appreciates today when investors expect higher US interest rates, better insurance from the dollar against global shocks, or higher convenience yields on dollar-denominated safe assets compared to foreign currency safe assets. This exchange rate valuation framework is similar to the cash flow and discount rate decomposition commonly used to understand variation in stock prices. Stock prices increase today either because investors expect higher cash flows or lower discount rates. The interest rate differences and the convenience yields represent the “cash flows” that accrue to foreign investors who have long positions in the dollar. Currency risk premia are the equivalent of “discount rates.”
Our research shows that the interest rate and risk premium drivers are relevant for understanding exchange rate variation in general, while the convenience yield channel is largely specific to the dollar. Our recent work focuses on the special roles the dollar plays in the international financial system.
The Convenience Yield Channel and the Dollar
The US is at the center of the international financial system today. The US is the world’s safe asset supplier and the dollar is the world’s reserve currency. Foreign investors derive extra convenience yields from holding dollar safe assets such as US Treasurys compared to foreign currency safe assets. We infer the size of these extra convenience yields earned by foreign investors from covered interest rate parity deviations in sovereign debt markets. When investors buy a foreign government bond and convert into a dollar payoff by hedging out the currency risk, they typically find that this “synthetic” Treasury is cheaper than the US Treasury of the same maturity. In other words, the yields on the synthetic Treasury are higher than actual Treasury yields.1 This yield differential reflects investors’ willingness to accept lower returns on US Treasurys due to their safety and liquidity benefits.
We measure the dollar’s convenience yield using the 1-year Treasury basis, which is defined as the difference between the 1-year foreign Treasury yield plus a currency forward contract that hedges the foreign exchange risk and the 1-year US Treasury yield.2 We use safe government bonds for G10 countries to measure foreign government yields, so that default risk is not a factor.
This convenience yield channel connects the dollar exchange rate to the global demand for and supply of safe assets. The dollar exchange rate constantly adjusts to clear the market for dollar-denominated safe assets as the convenience yield on dollar safe assets such as Treasurys varies over time. As predicted by the exchange rate valuation framework, the dollar appreciates instantaneously against G10 currencies when the global demand for dollar safe assets increases, which corresponds to wider Treasury bases. One example of a positive demand shock was the 2008–09 Global Financial Crisis (GFC). Figure 1 plots the equal-weighted dollar exchange rate against other G10 currencies and the average across G10 Treasury bases in 2008. In this period, the US Treasury basis widened by 60 basis points, while the dollar appreciated by 14.3 percent.
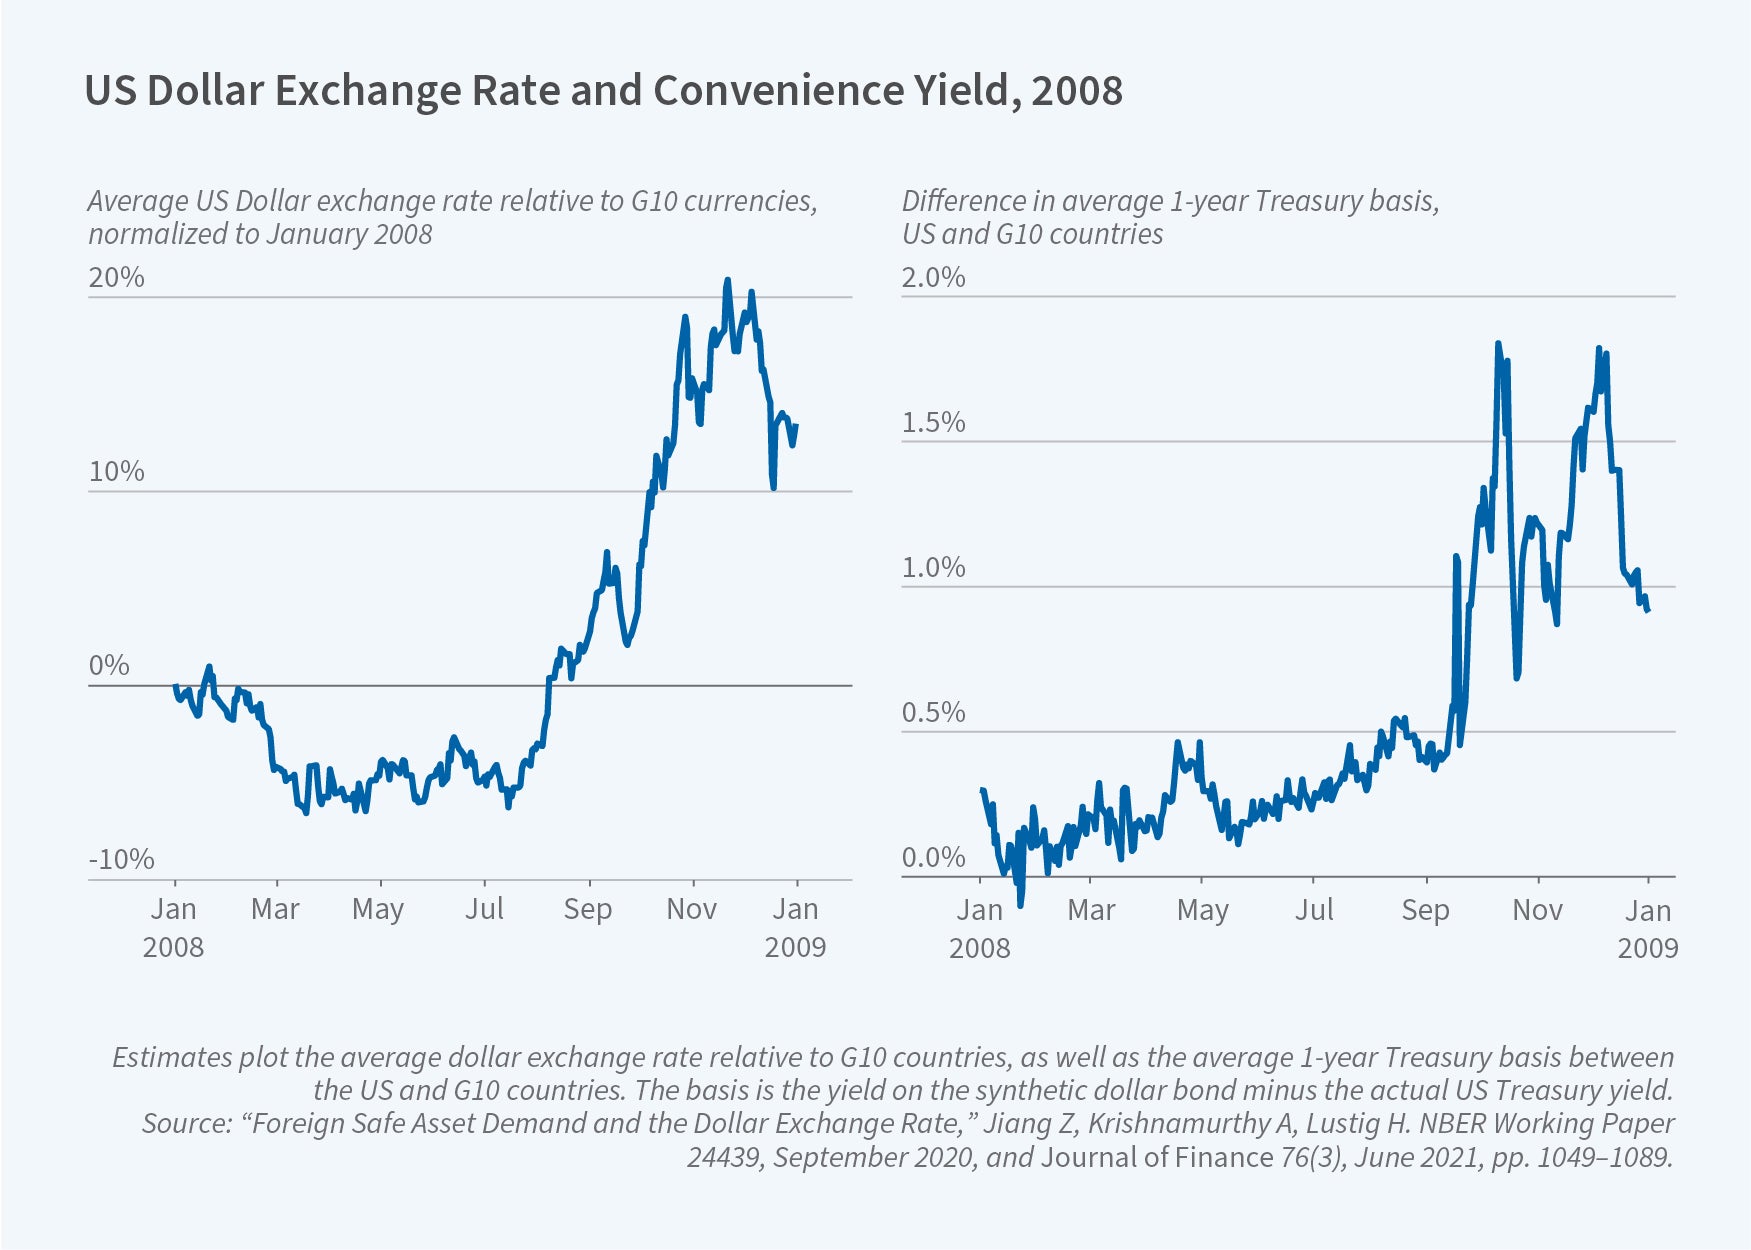
This flight to the safety of Treasurys is also borne out by the large net purchases of Treasurys by the rest of the world during the GFC. Foreigners were the largest net purchases of US Treasurys, dominating all other sectors combined.
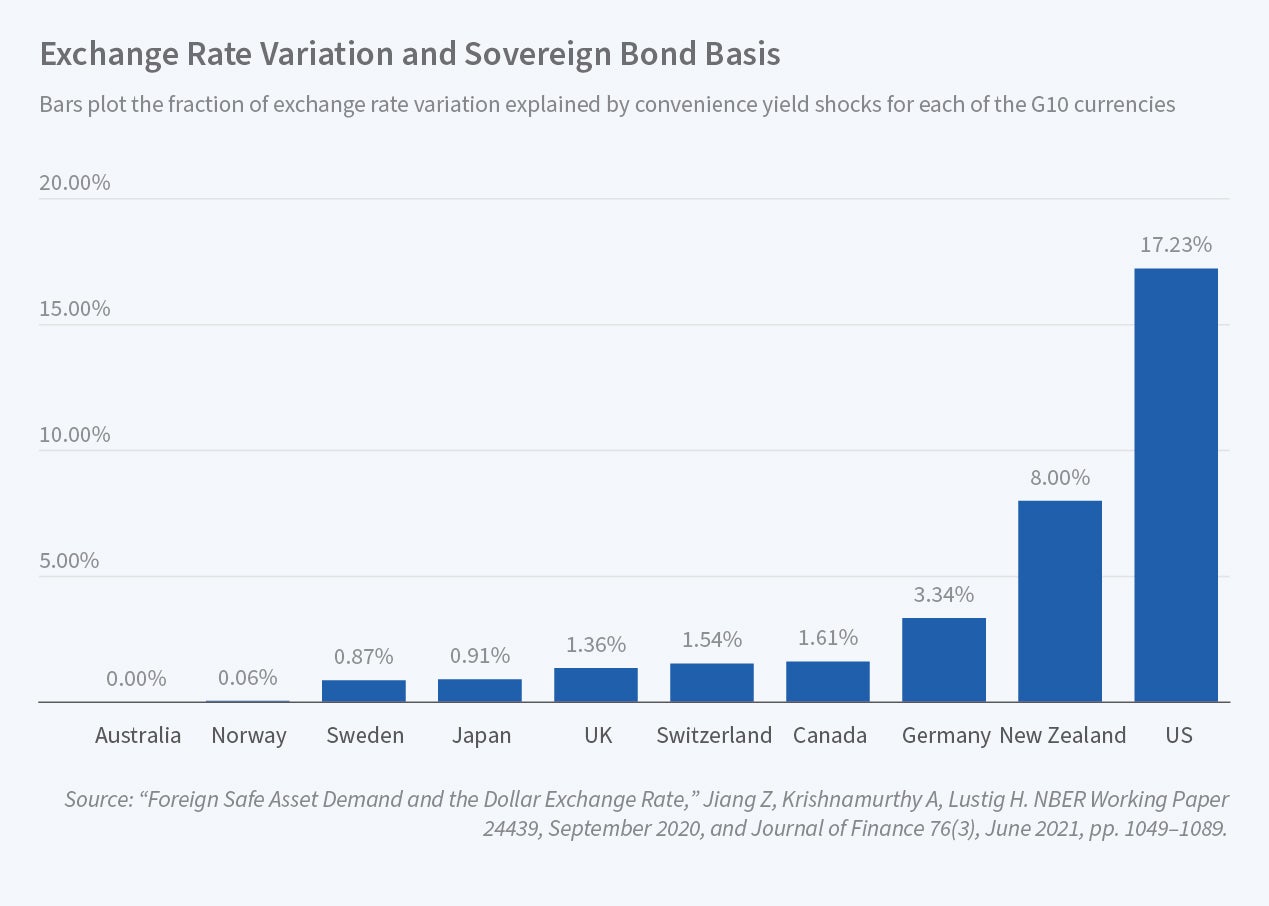
When we study the time series of the dollar exchange rate since 1988, we find that the Treasury basis can explain 17 percent of the quarterly variation in the dollar against G10 currencies. This is not the case for other currencies. Figure 2 presents the fraction of exchange rate variation explained by convenience yields for each of the G10 currencies. The convenience yield factor is far more important for the dollar than any of the others. The yen equivalent of the Treasury basis, for example, measured from Japanese government bonds, explains only about 1 percent of the variation in the yen exchange rate.
An important, but nuanced, point is that all safe dollar assets earn the dollar’s convenience yield. While 1-year Treasurys, which have been the dollar safe assets par excellence, offer the highest convenience yield, other dollar safe assets also offer high convenience yields. Indeed, we find that the Treasury basis is only about 10 percent of the extra convenience yield investors derive from a cash position in dollar-denominated Treasurys, whereas the remaining 90 percent is shared across all dollar safe assets.
The Interest Rate and Risk Premium Channels
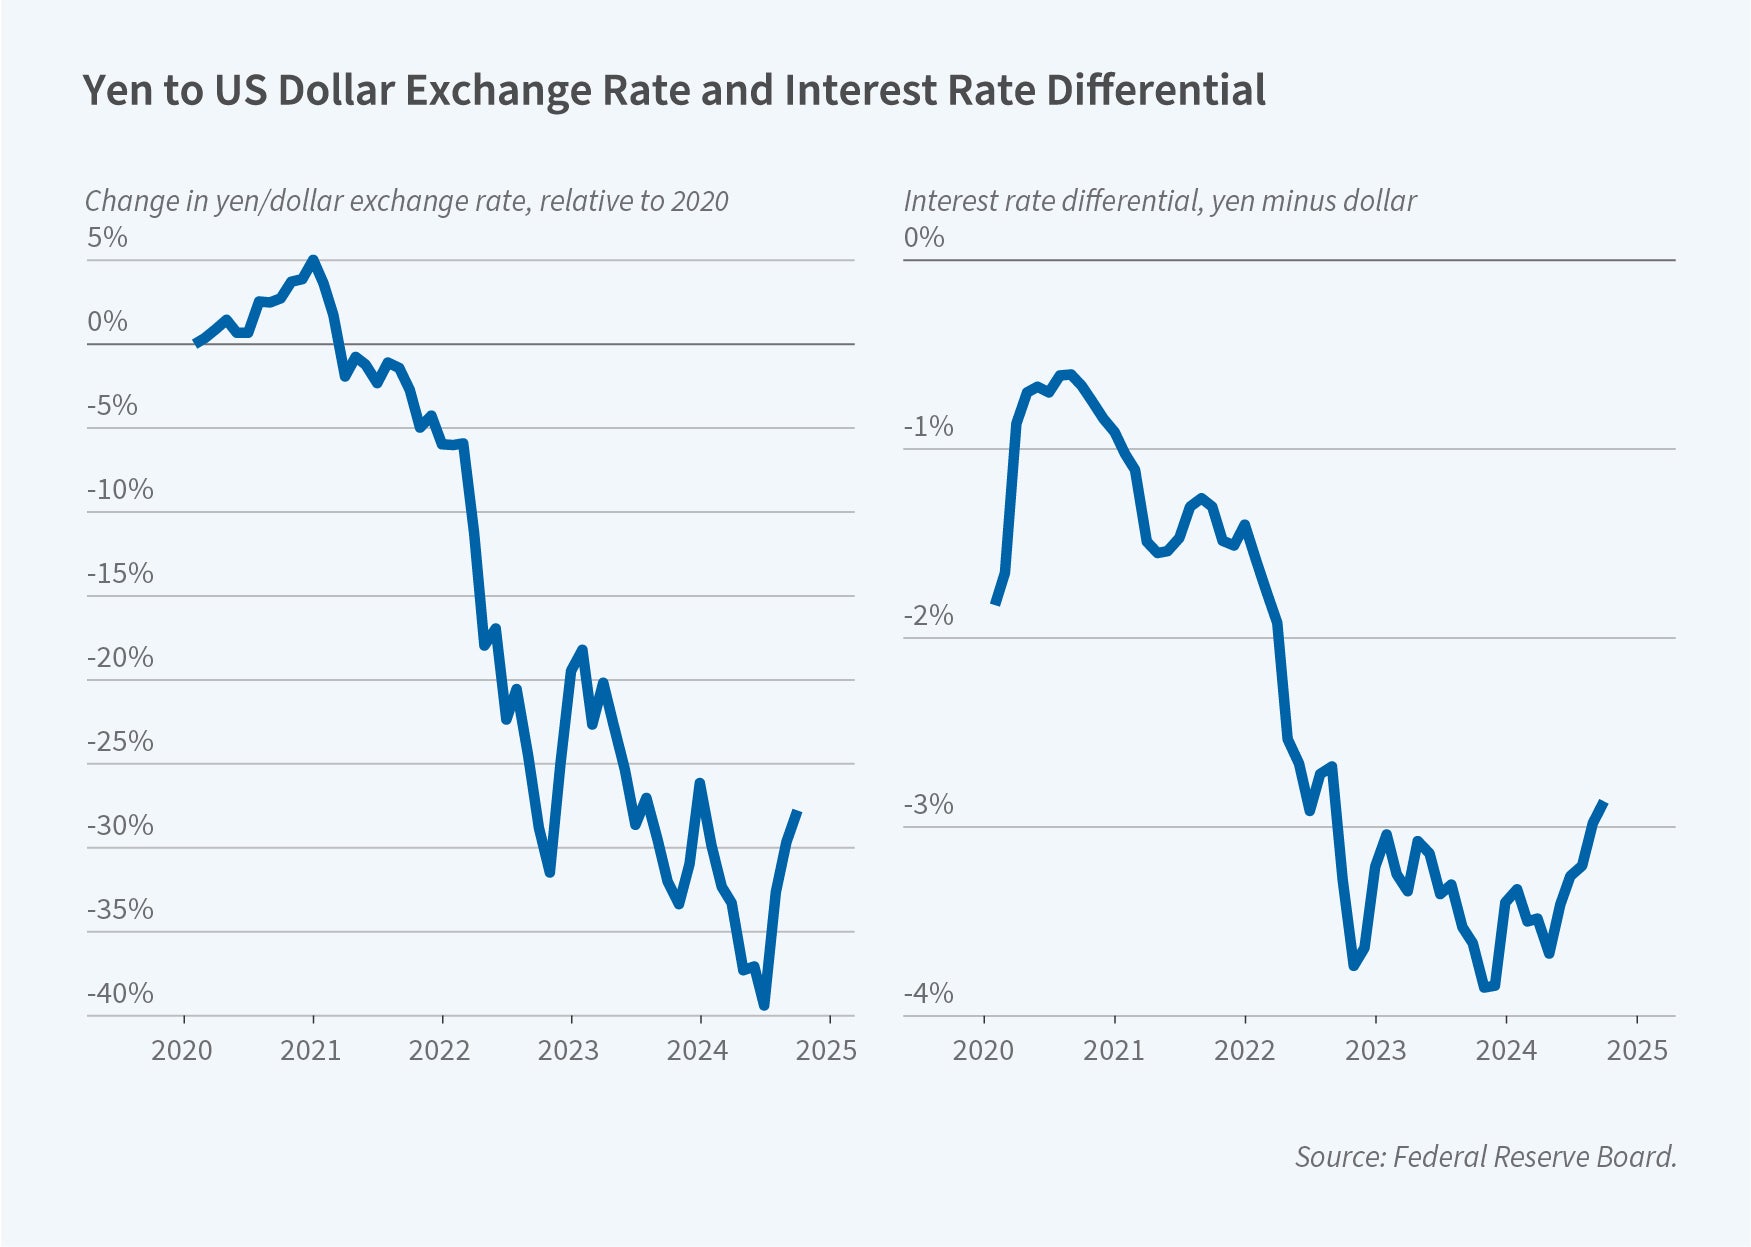
Comparing the convenience yield channel to the interest rate and risk premium channels offers additional insight about the drivers of exchange rates. Consider the interest rate channel first. An interesting case study is the recent behavior of the yen/dollar exchange rate. Because of the Bank of Japan’s low-rate policies, including its yield curve control policy, Japanese short- and long-term rates have been close to zero, as other countries, including the US, started to tighten and rates increased. The yen, in light blue (Figure 3a), has depreciated by 24 percent against the dollar since 2021 as foreign rates lifted off from the zero lower bound. Figure 3a shows that the yen depreciation is mirrored almost perfectly by changes in the interest rate spread between Japan and the US. The 10-year yields reflect not only the current short-term interest rate, but also the market’s expectation of the future short rates.3 The yen has depreciated against the dollar as the long-term yield gap between Japan and the US widened.
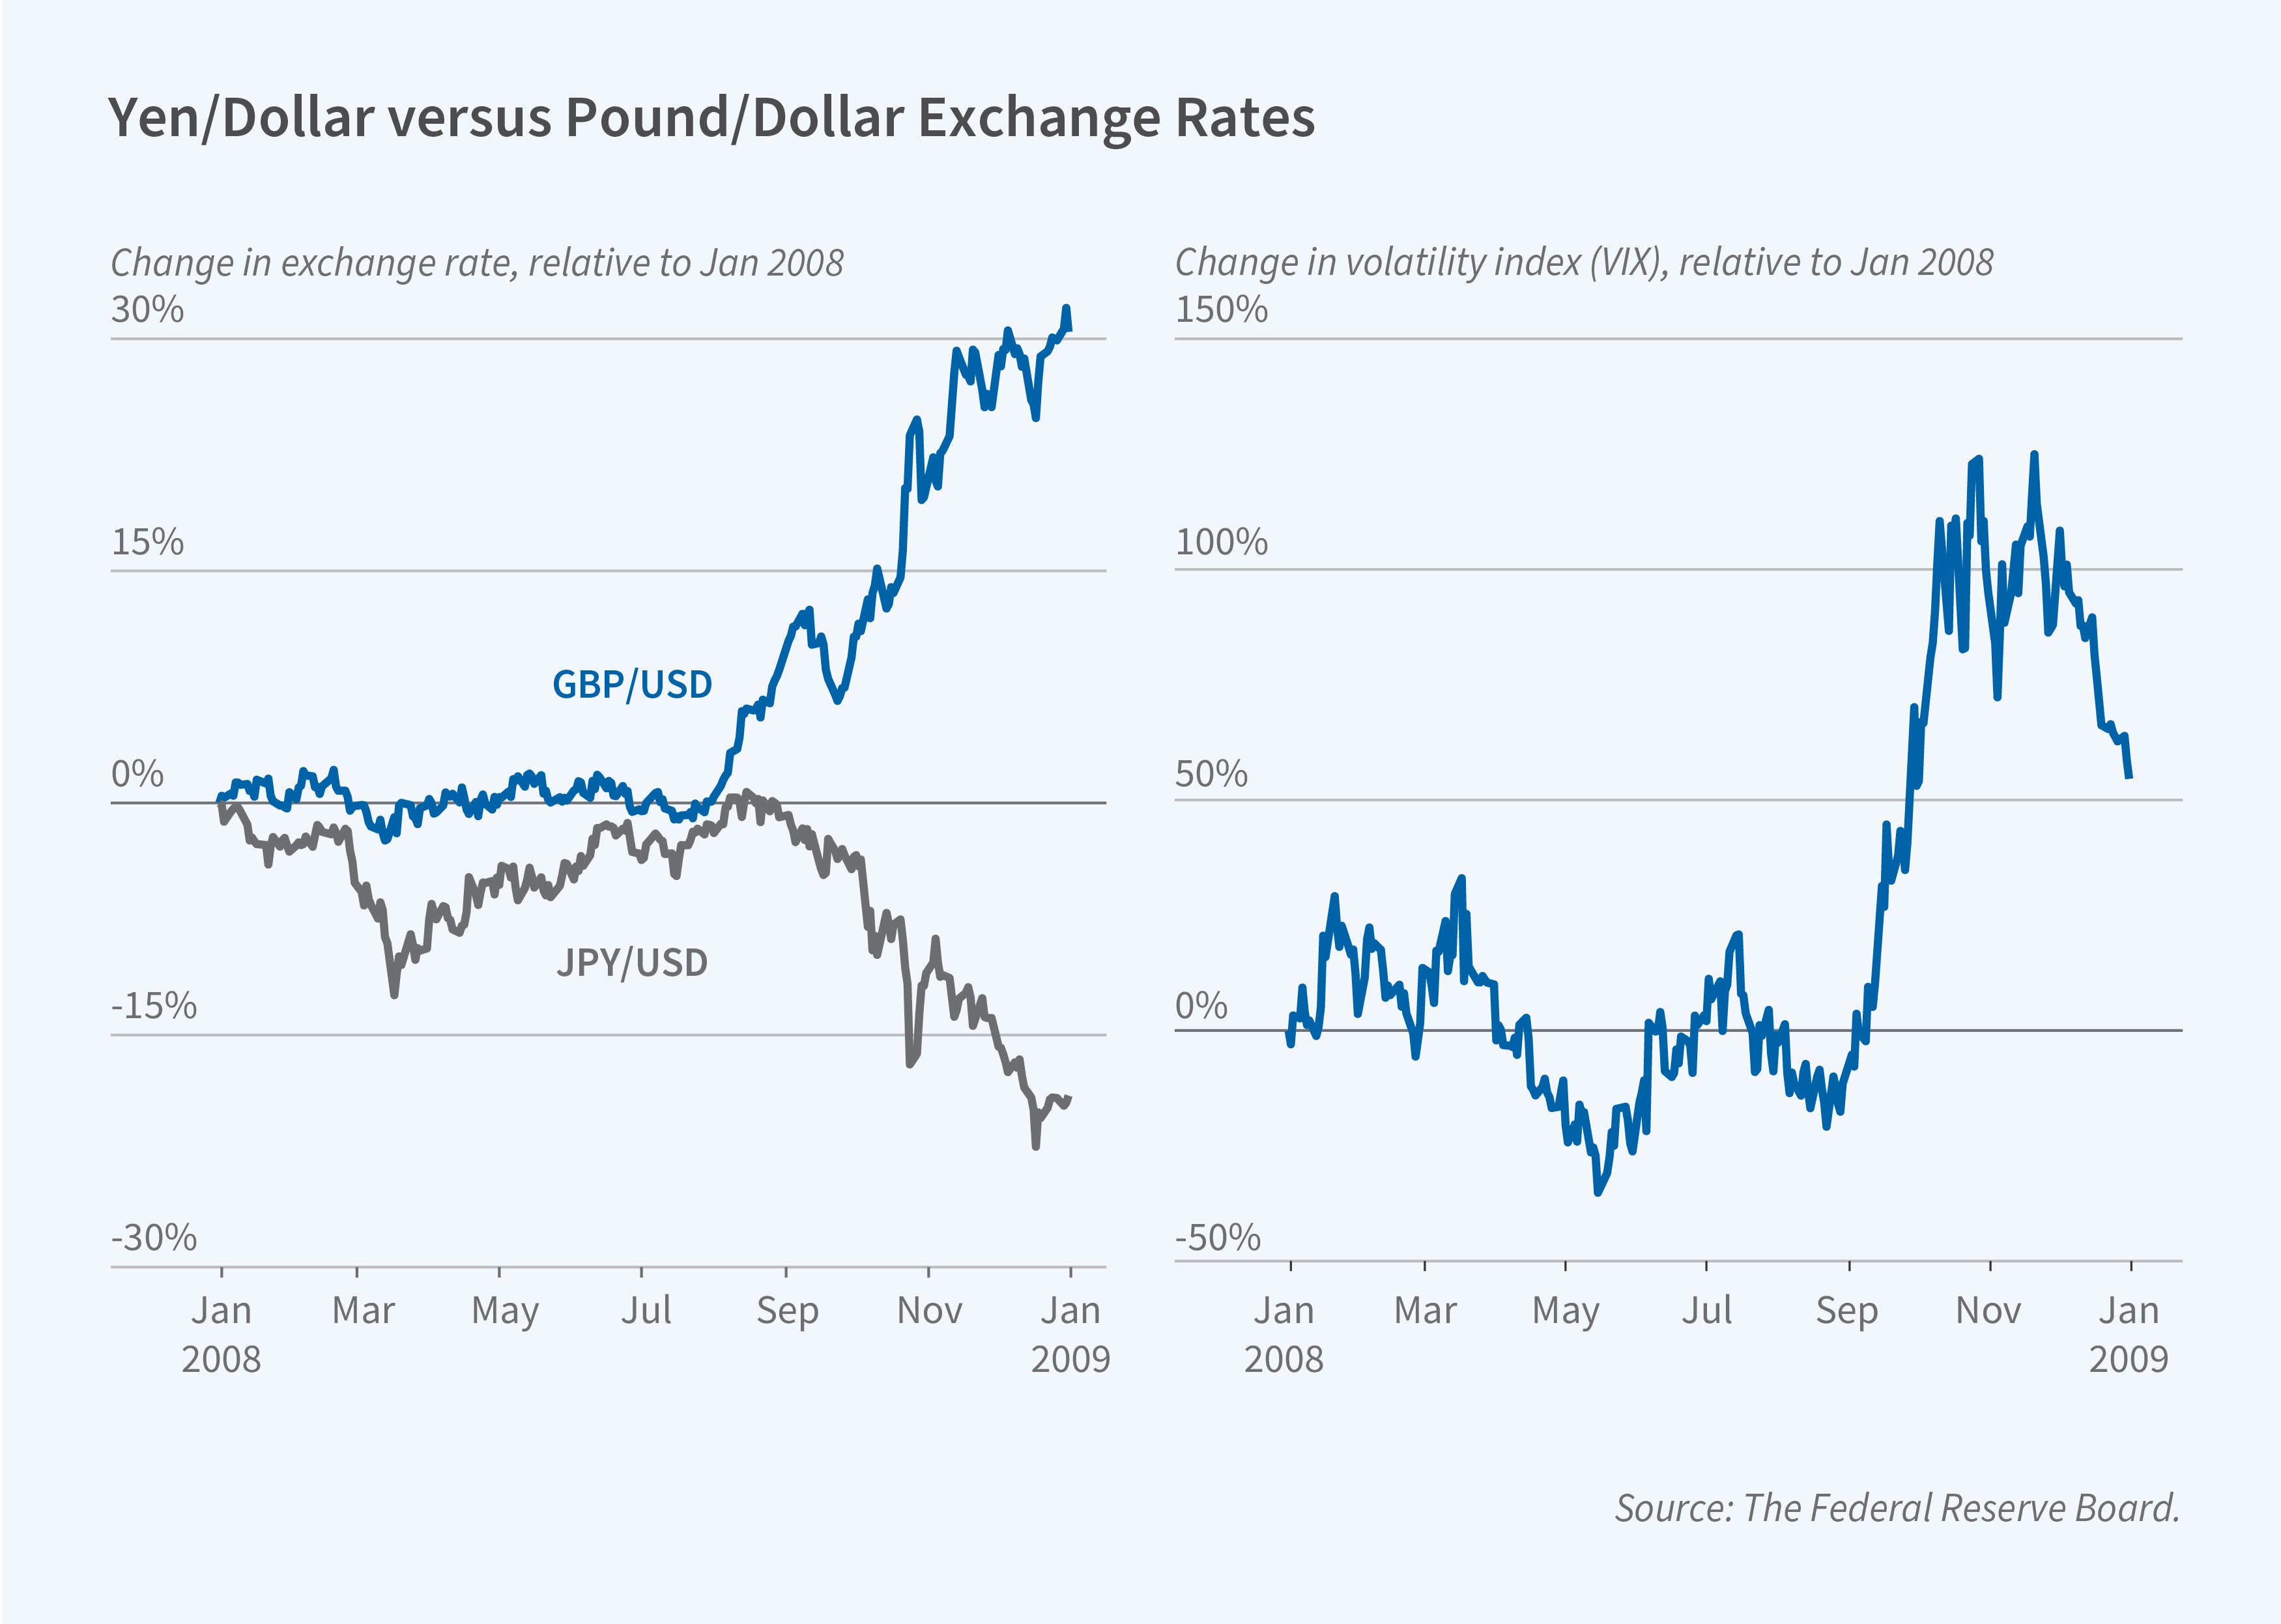
In this recent episode, movements in the yen were largely driven by interest rate differentials, but there are other periods in which the yen’s currency risk premium was the dominant driver. Figure 3b plots exchange rate movements of the pound and the yen as well as the VIX during the GFC. The yen, a low interest rate or funding currency, appreciated against the dollar, while the pound, a higher interest rate currency, depreciated, as the VIX increased in the fall of 2008. The yen is a “safe-haven” currency that appreciates during global downturns.4 It is special in that it appreciates even against the dollar. Given this insurance characteristic, the yen carries a negative currency risk premium. Foreign investors value assets that appreciate in global downturns. As a result, they are willing to accept lower returns when investing in yen.
Global Insurer versus Safe Asset Supplier
If a country has persistently lower interest rates than other countries, the low rates need to be justified by some offsetting benefits: either foreign investors value the currency because it offers protection against global shocks, as in the case of the yen, or safe assets denominated in that currency offer extra convenience yields, as in the case of the dollar. Both Japan and the US have low interest rates and currencies that tend to appreciate during global downturns, but for different reasons. This distinction matters.
Japan is a surplus country that does not have to attract net capital inflows from abroad. Over the past decades, Japan has accumulated a large positive net foreign asset position. The Japanese government and its taxpayers run a multitrillion dollar carry trade by borrowing locally at low interest rates and investing abroad at higher interest rates. The consolidated Japanese government funds itself at the rate of interest on reserves in yen, through the Bank of Japan’s bond purchases and its issuance of bank reserves, and then goes long in foreign bonds and equities without hedging the currency risk, mainly through the government-run pension fund.5 This is a profitable but risky trade that helps the Japanese government finance large deficits. Foreign investors pay an insurance premium when they go long on the yen. The consolidated Japanese government pockets these insurance premia. During times of turmoil, the yen appreciates and the Japanese government suffers losses on its carry trade. Indeed, when the VIX spiked in August 2024, there was a reversal of the carry trade. The yen appreciated by 4 percent from July 31 to August 5, 2024, leading to losses to the Japanese government and taxpayers. In this sense, Japanese taxpayers provide insurance to the rest of the world by bearing losses in times of heightened global volatility.
By contrast, the US is a deficit country but still manages to attract sufficient foreign capital inflows in spite of its lower rates, albeit not as low as the Japanese rates. Over the past decades, the US has accumulated a large negative net foreign asset position. The US government and the private sector run a different carry trade relative to the rest of the world. The US borrows abroad by selling dollar safe assets to the rest of the world and then goes long in risky foreign assets.6 In doing so, the US earns a profit on average from the convenience yield on this carry trade.
However, in this carry trade, the US is not insuring the rest of the world. Rather, as a supplier of safe assets, the US provides the rest of the world with a stream of safety and liquidity services, resulting in significant seigniorage revenue. In times of increased volatility, convenience yields increase and the US earns more seigniorage revenue on its supply of safe assets. This additional revenue allows the US to run larger current account deficits. The present value of these carry trade profits gives the US the capacity to absorb the portfolio losses due to dollar appreciation.7,8 As a result, the US government gains additional fiscal capacity, and the private sector gains extra borrowing capacity during a global downturn.
As the primary supplier of safe assets, the US enjoys a countercyclical revenue stream that boosts the government’s fiscal capacity in times of stress. No other nation is in this position. However, the convenience yields on US Treasury bonds have declined over the last few years. At the onset of the COVID-19 pandemic, there was no flight to the safety of Treasurys. In fact, the 10-year Treasury yield increased by 70 basis points between March 9 and March 18, 2020, in line with UK, German, and French yields. Foreign investors sold Treasurys in the first quarter of 2020. Those sales were concentrated at the long end. In March 2020, foreign investors sold more than $400 billion of US Treasury notes and bonds. The next month, they sold another $200 billion. Importantly, foreign investors were not selling corporate bonds or agency bonds.
The Dollar Is Special, but for How Long?
Global demand for the safety and liquidity of US Treasurys is downward sloping. The convenience yield on Treasurys varies in response to shifts in the supply of dollar safe and liquid assets. The evidence for this is clearest in Krishnamurthy and Annette Vissing-Jorgensen’s work, which examines variation in Treasury supply and convenience yields since 1920.9
At the start of the GFC, the US total public debt to GDP ratio was 64 percent. Today it is 120 percent. As the US has increased the supply of dollar-denominated safe assets over this period, the convenience yields on Treasurys have decreased. Figure 4 shows the Treasury basis for 1-year, 5-year, and 10-year bonds from 1996 to 2024. The basis has clearly declined as the quantity of Treasury debt has increased. Jiang, Robert Richmond, and Tony Zhang present statistical evidence tying increased debt supply to declines in the Treasury basis.10 Roberto Gomez Cram, Howard Kung, and Lustig report high-frequency evidence that the convenience yield on US Treasurys decreases on days when investors receive adverse fiscal news that increases expected future Treasury supply.11
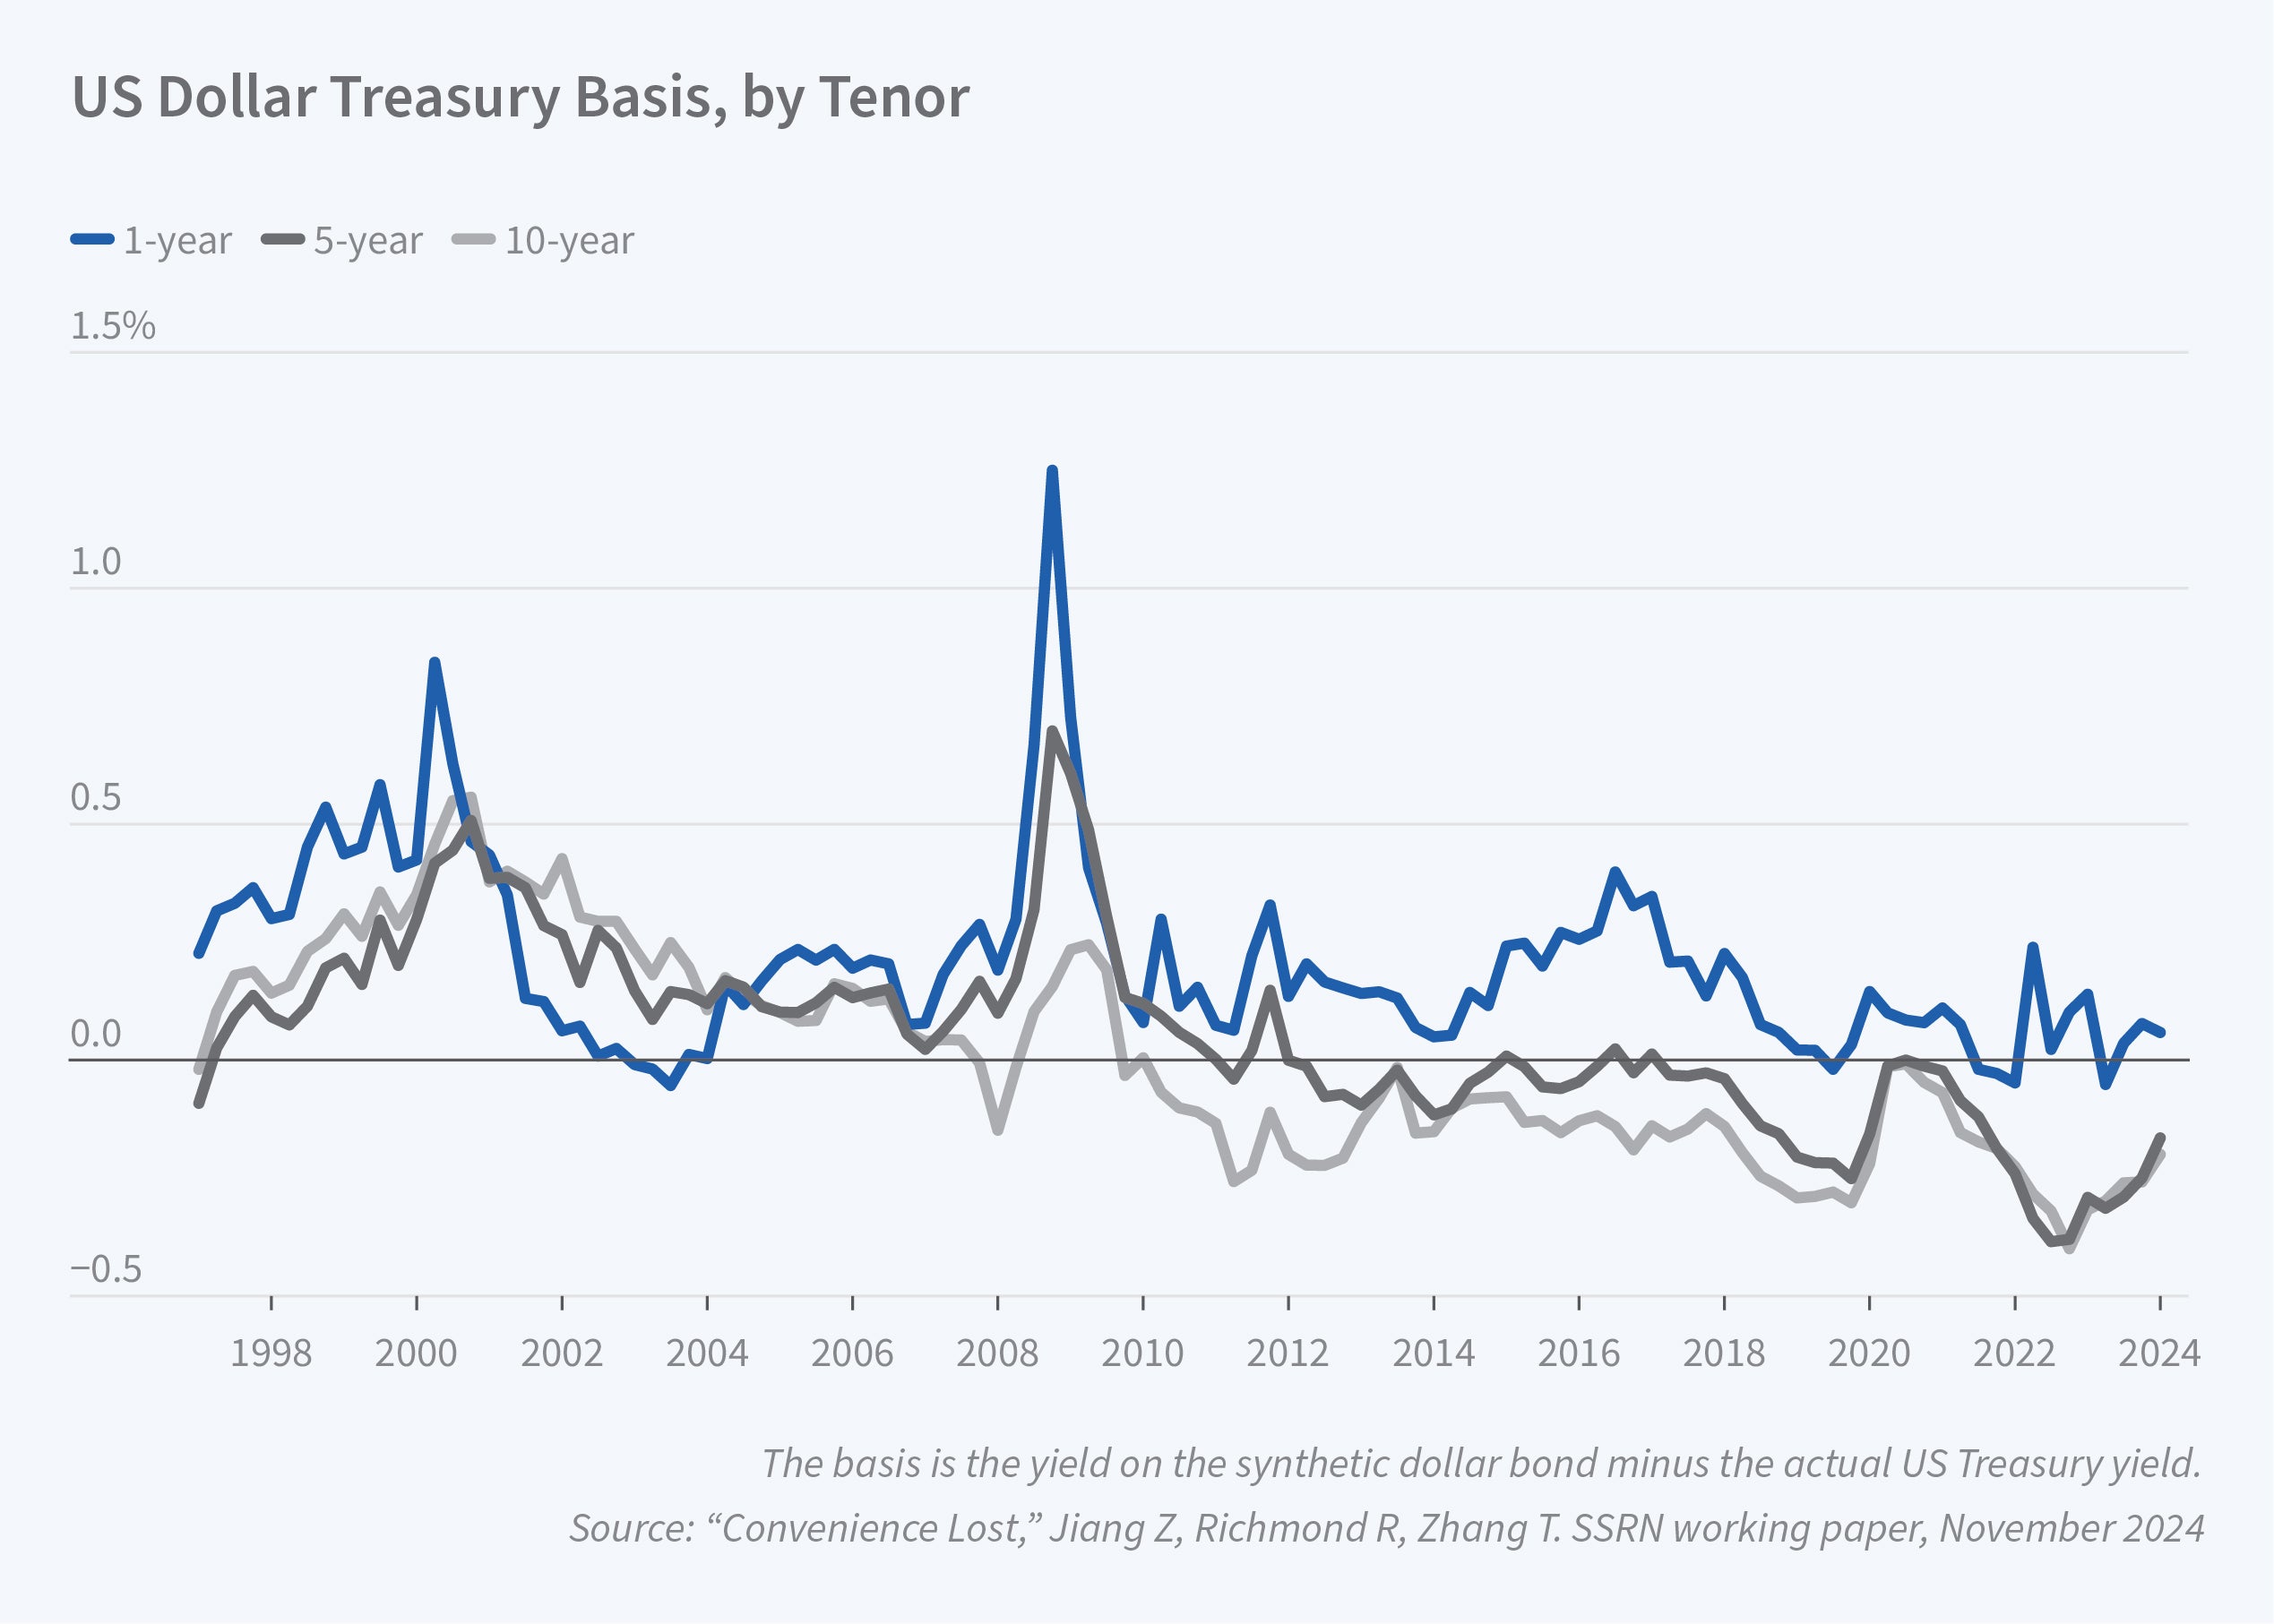
During the COVID-19 pandemic, the convenience yield on Treasurys continued to decline as investors anticipated a large increase in their supply as a result of increasing deficits.12,13 In Figure 4 we can see that only the 1-year Treasury basis remains positive and is higher than the 5-year and 10-year bases. The bases in US Treasurys have actually flipped signs at longer tenors, suggesting that the convenience yields are expected to decline in the future. This is consistent with other evidence. At the 10-year horizon, US Treasurys no longer trade at a premium relative to AAA corporates, once one corrects for the measured credit risk of corporates.
Because of these fiscal developments, the convenience yield channel for the dollar may be weakening, and the dollar might start to trade more like other currencies. This may cause the US’ countercyclical revenue stream from supplying the world with safe assets to dry up. When the hegemony of the dollar ends, the extra fiscal capacity that bond markets have allocated to the US may be withdrawn. That’s what the experience of the UK and the Dutch Republic teaches us.14,15
Endnotes
“The US treasury premium,” Wenxin D, Im J, Schreger J. The Journal of International Economics 112, 2018, pp. 167–181.
“Foreign safe asset demand,” Zhengyang Z, Krishnamurthy A, Lustig H. NBER Working Paper 24439, September 2020, and The Journal of Finance 76, 2021, pp. 1049–1089.
“The term structure of currency carry trade risk premia,” Lustig H, Stathopoulos A, Verdelhan A. NBER Working Paper 19623, November 2013 and American Economic Review 109, 2019, pp. 4142–4177.
“Common Risk Factors in Current Markets,” Lustig H, Roussanov N, Verdelhan A. Review of Financial Studies 24(11), 2011, pp. 3731–3777.
“What about Japan?” Chien YL, Cole HL, Lustig H. NBER Working Paper 31850, November 2023.
“From World Banker to World Venture Capitalist: US External Adjustment and the Exorbitant Privilege,” Gourinchas PO, Rey H. NBER Working Paper, August 2005, and G7 Current Account Imbalances: Sustainability and Adjustment, Clarida RH, editor, pp. 11–66. Chicago: University of Chicago Press, 2007.
“Dollar Safety and the Global Financial Cycle,” Jiang Z, Krishnamurthy A, Lustig H. NBER Working Paper 27682, August 2020, and Review of Economic Studies 91, (5), October 2024, pp. 2878–2915.
“Exorbitant Privilege: A Safe-Asset View,” Jiang Z. NBER Working Paper 32454, September 2024.
“The Aggregate Demand for Treasury Debt,” Krishnamurthy A, Vissing-Jorgensen A. Journal of Political Economy 120, 2012, pp. 233–267.
“Can US Treasury Markets Add and Subtract?” Gómez-Cram R, Kung H, Lustig H. Working Paper, 2023.
“Are US Treasury Bonds Still a Safe Haven?” He Z, Krishsnamurthy A. NBER Reporter, 2020:3, pp. 20-24.
“Government Debt in Mature Economies. Safe or Risky?” Gómez-Cram R, Kung H, Lustig H. Working Paper, 2024.
“Exorbitant Privilege Gained and Lost: Fiscal Implications,” Zefeng C, Jiang Z, Lustig H, Van Nieuwerburgh S, Xioalan M. NBER Working Paper 30059, May 2022, and forthcoming in Journal of Political Economy.
“Liquidity, Debt Denomination, and Currency Dominance,” Coppola A, Krishnamurthy A, Xu C. NBER Working Paper 30984, February 2023.


