The Startup Cartography Project
Academic researchers and policymakers have long recognized that high-growth startups contribute disproportionately to innovation and economic performance. The outsized success of regions such as Silicon Valley has inspired economists to study the link between entrepreneurship and regional economic performance, and economic developers to promote initiatives that nurture the establishment and expansion of new firms.
But evaluating entrepreneurial “ecosystems” raises an empirical challenge: How can one measure the state of an entrepreneurial ecosystem at a point in time, track changes in that system over time, or make comparisons across or within regions at different levels of geographic granularity? This challenge is particularly salient given that the geographical unit of analysis might vary from a few blocks around a university campus to cities, states, or even countries, and that the outcomes from any given cohort of startups within that region are highly skewed and significantly lagged in time.
By and large, previous assessments of entrepreneurial ecosystems focused on measuring the number of new firms founded at a given point in time within a fixed geographic domain, or conditioned the study on firms that satisfied a set of predetermined performance criteria, such as the receipt of venture funding or achievement of certain employment levels. While these approaches offer valuable insights, they do not fully address the challenges of skewness, lagged performance, and geographic granularity. While a quantity-based approach tends to abstract away differences among firms at the time of founding (which might be related to later differences in performance) conditioning on intermediary outcomes such as the receipt of venture capital conflates the measurement of the rate of entrepreneurship with that cohort’s subsequent performance. If the rate of venture financing in a given region is low, does that imply that there is too little venture capital, or are there too few firms with the potential to attract such financing?
A Choice-Based Predictive Analytics Approach
Our work was initially motivated by a debate about both the level of and changes in the rate of entrepreneurship in the United States. On the one hand, data drawn from the US Census Bureau identified that while the bulk of net new job creation resulted from employment growth by young firms, the United States had experienced a long secular decline in the rate of new firm formation.1 At the same time, the rate of private financing of firms with high growth potential — such as early-stage venture capital — was highly cyclical and had increased significantly over time.2 This contrast led to seemingly puzzling results: benchmarks of regional entrepreneurial ecosystems would regularly highlight locations with high rates of new firm formation, such as Montana and Miami, that were at variance with assessments that focused on active risk capital markets, such as those in Silicon Valley or Boston.
Our research is premised on one foundational insight: the measurement of entrepreneurship benefits from estimating entrepreneurial “quality” as part of any metric. This approach combines three interrelated insights. First, state-level business registration records, which are the legal documents filed by founders to establish a company, provide rich and timely data about new firm formation. Second, business registration records, along with other data linked through location and name matching, provide information about the founders’ choices at or near the time of founding. A founder using the term “restaurant” in their firm name presumably intends to run a restaurant — a domain with limited growth potential — while founders who include the term “biotechnology” have ambitions with higher growth potential. Applying for formal intellectual property rights, such as a copyright or patent, and investing in a higher form of corporate governance, for example, by registering the firm as a corporation under Delaware jurisdiction, reflect early choices by a founder that signal that founder’s ambitions for the growth potential of their firm. Finally, extreme growth events, such as an initial public offering or large acquisition within a certain time frame, are observable, making it possible to map the likelihood of these growth events against the observed choices of business registrants across the population of business registrants.
We first experimented with this approach in two proof-of-concept studies. In one, we use this methodology to capture the variation in the quantity and quality of entrepreneurship across California, demonstrating that the approach infers both the location of Silicon Valley relative to Southern California as well as variation within that region.3 In the second, we use data from Massachusetts to illustrate how the approach can illuminate the micro-geography of entrepreneurship and chart the evolution of an entrepreneurial ecosystem over time.4
The Startup Cartography Project Database and Key Findings
Following our proofs of concept, we scaled this methodology by examining a dataset from across the US and over an extended period of time.5,6 Along with our regular collaborator Catherine Fazio as well as other collaborators on particular projects, we have developed the Startup Cartography Project (SCP), which combines state-level business registration records with predictive analytics to advance a set of novel metrics for the United States. With R. J. Andrews, Fazio, and Yupeng Liu, we construct a comprehensive and publicly accessible set of entrepreneurial ecosystem statistics for 49 states over the period 1988–2014 and 46 states through 2016.7 The SCP is accessible to researchers at multiple levels of aggregation, including state, metropolitan statistical area, county, and zip-code level, and includes a dynamic mapping tool that enables users to visualize both the quality and quality of entrepreneurship by year down to the level of individual street addresses.
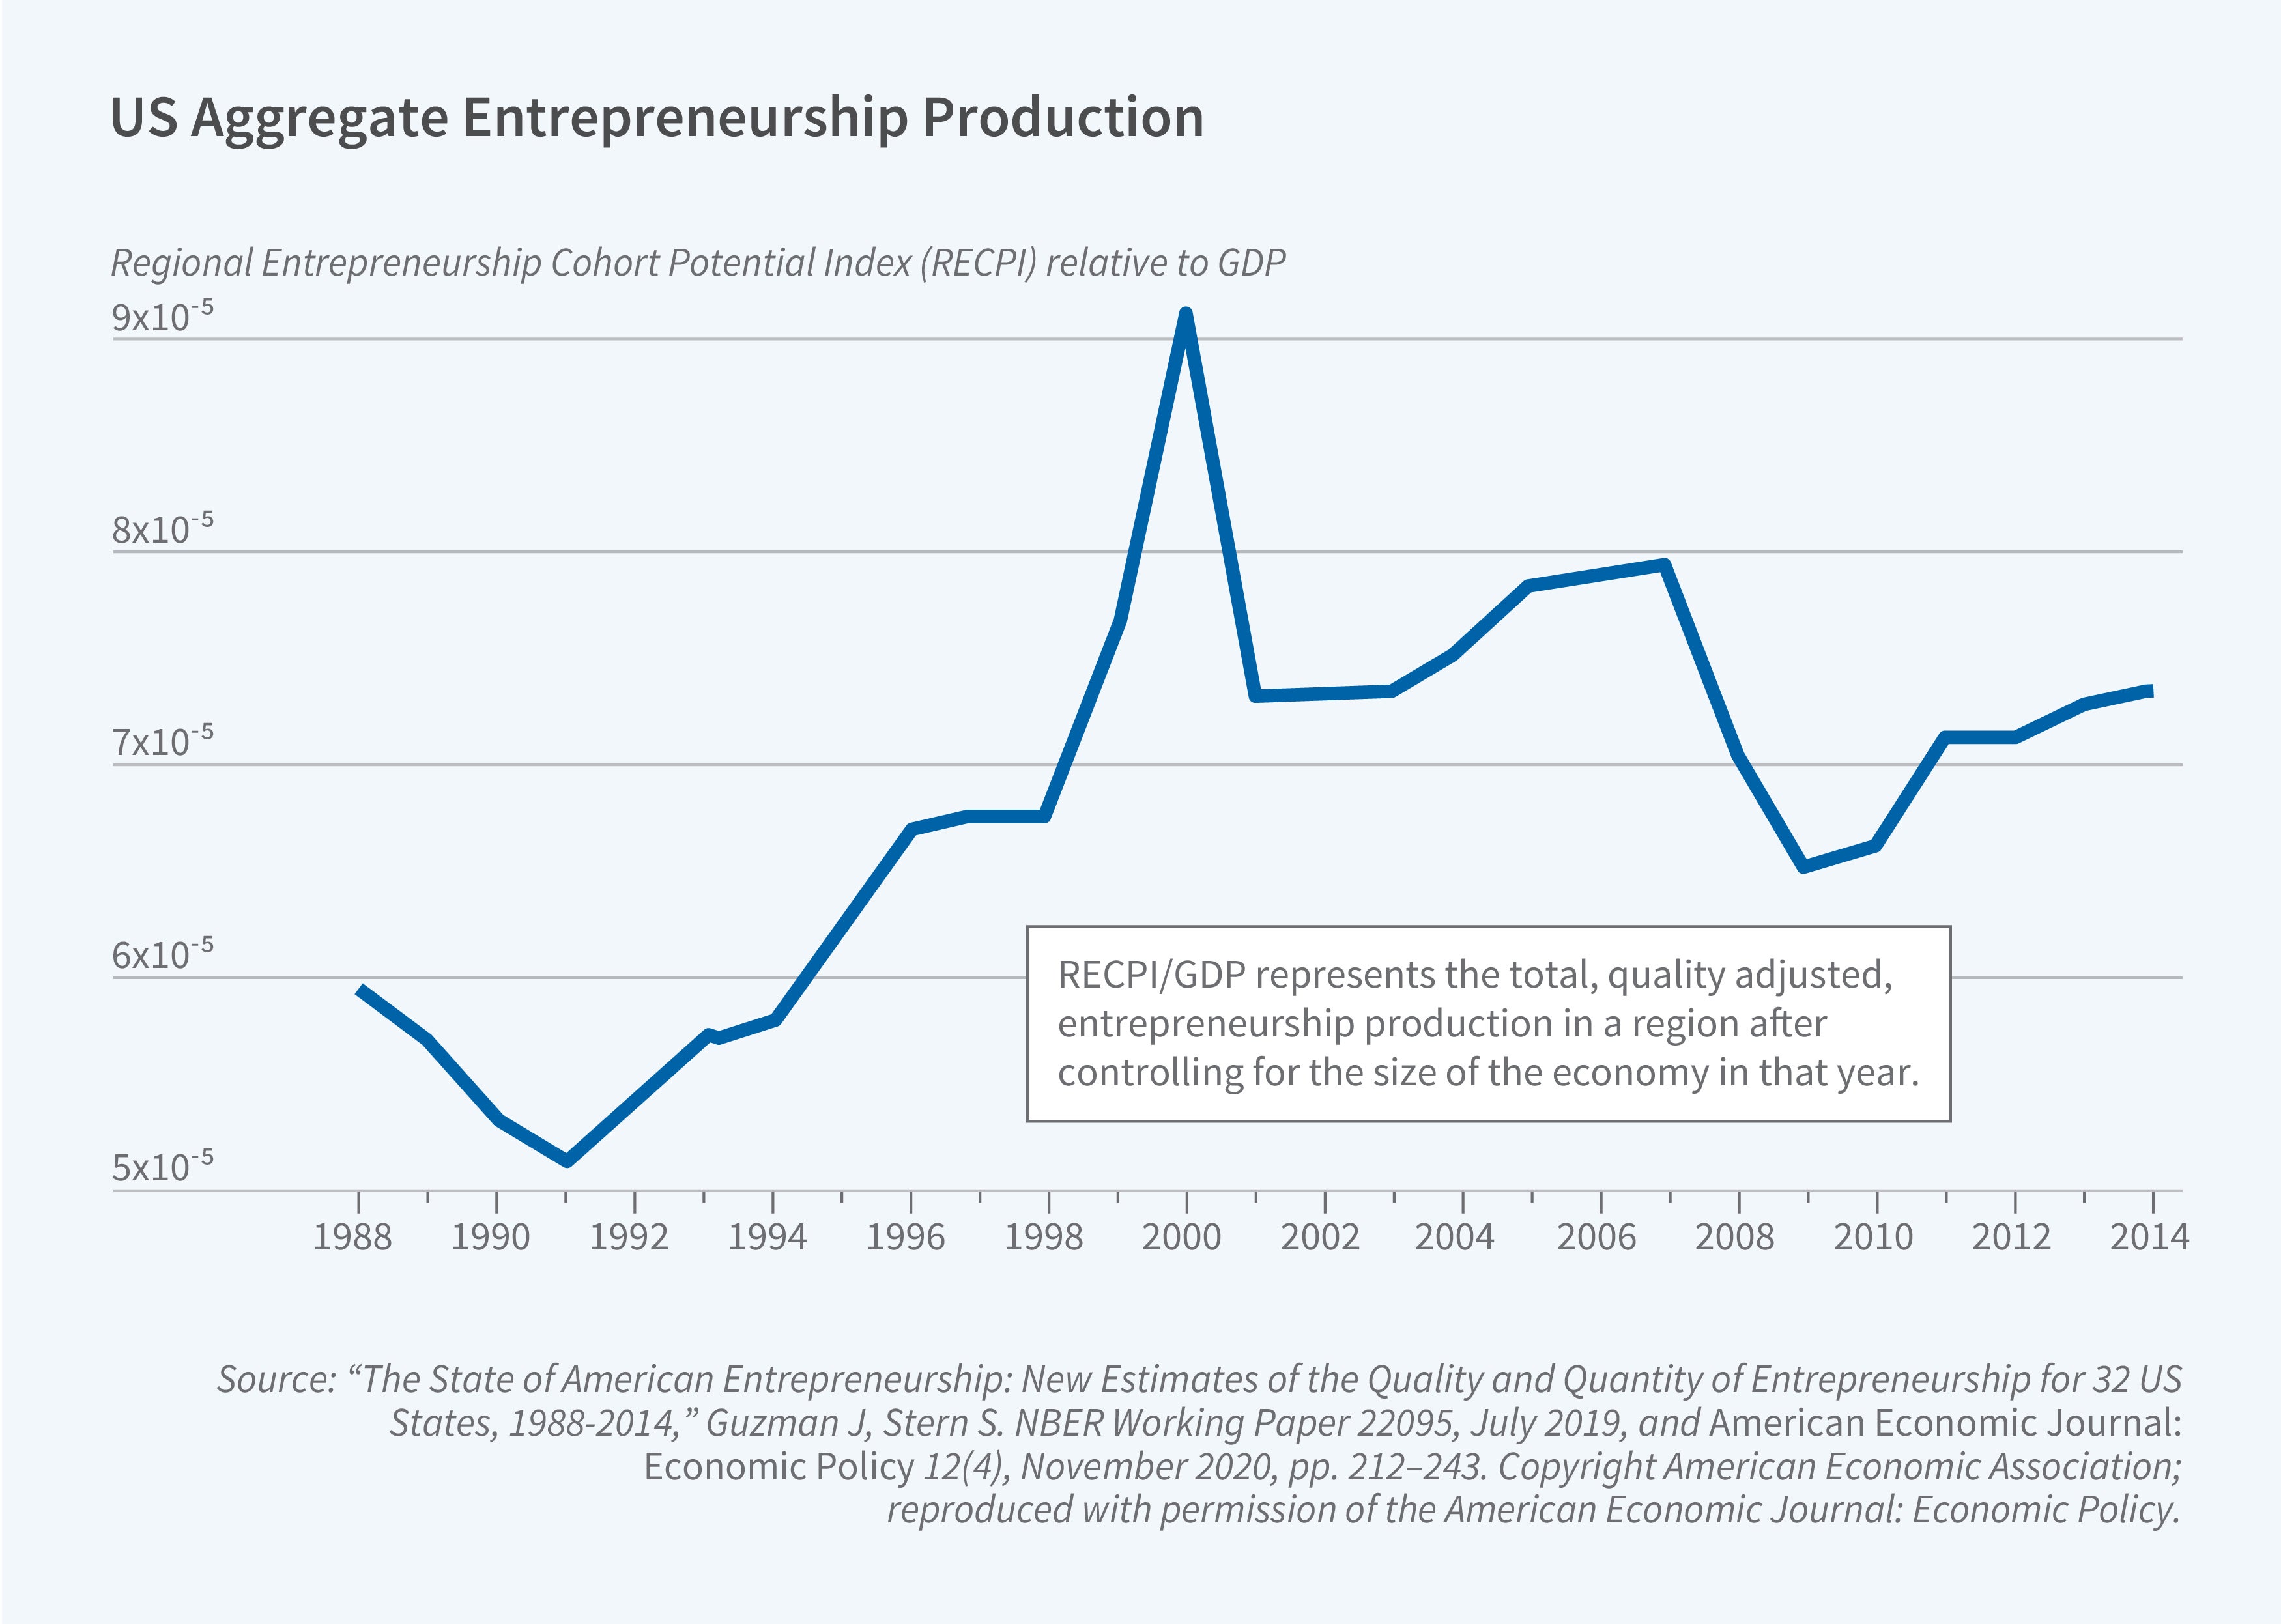
We use data from 32 states to first document the correlation between startup characteristics and the probability of growth. For example, a new firm organized as a corporation that registers in Delaware and files for a patent within a year of its launch is 84 times more likely to grow than a startup organized as a partnership or LLC and registered in its home state. These positive associations are relatively stable over time. We then leverage this predictive analytic approach to formulate four economic statistics that reliably predict across years and multiple levels of geographic aggregation: the number of new firms founded within a cohort, the Startup Formation Rate; the average growth potential of a cohort of new firms, the Entrepreneurial Quality Index; the number of growth outcomes expected in a given region, the Regional Entrepreneurship Cohort Potential Index (RECPI); and the ability of a given region to convert entrepreneurial potential into realized growth, the Regional Entrepreneurship Acceleration Index. Our quality-adjusted estimates reveal a nuanced and distinct picture. The rate of high-growth-potential entrepreneurship, captured by RECPI, follows a cyclical pattern sensitive to economic and capital market conditions. This is shown in Figure 1, which highlights the importance of accounting for entrepreneurial potential when assessing the “state” of entrepreneurship across regions or over time.
Our results suggest that a small number of governance and intellectual property characteristics predict firm quality. In an out-of-sample test, 54 percent of realized growth outcomes, and nearly 37 percent in the top 1 percent of the estimated quality distribution, occur in the top 5 percent of our estimated quality distribution. Given the extremely skewed nature of entrepreneurial quality, nearly 4,000 local limited liability companies — the modal firm in our data — are associated with the same quality potential as a single Delaware corporation with an early patent and trademark.
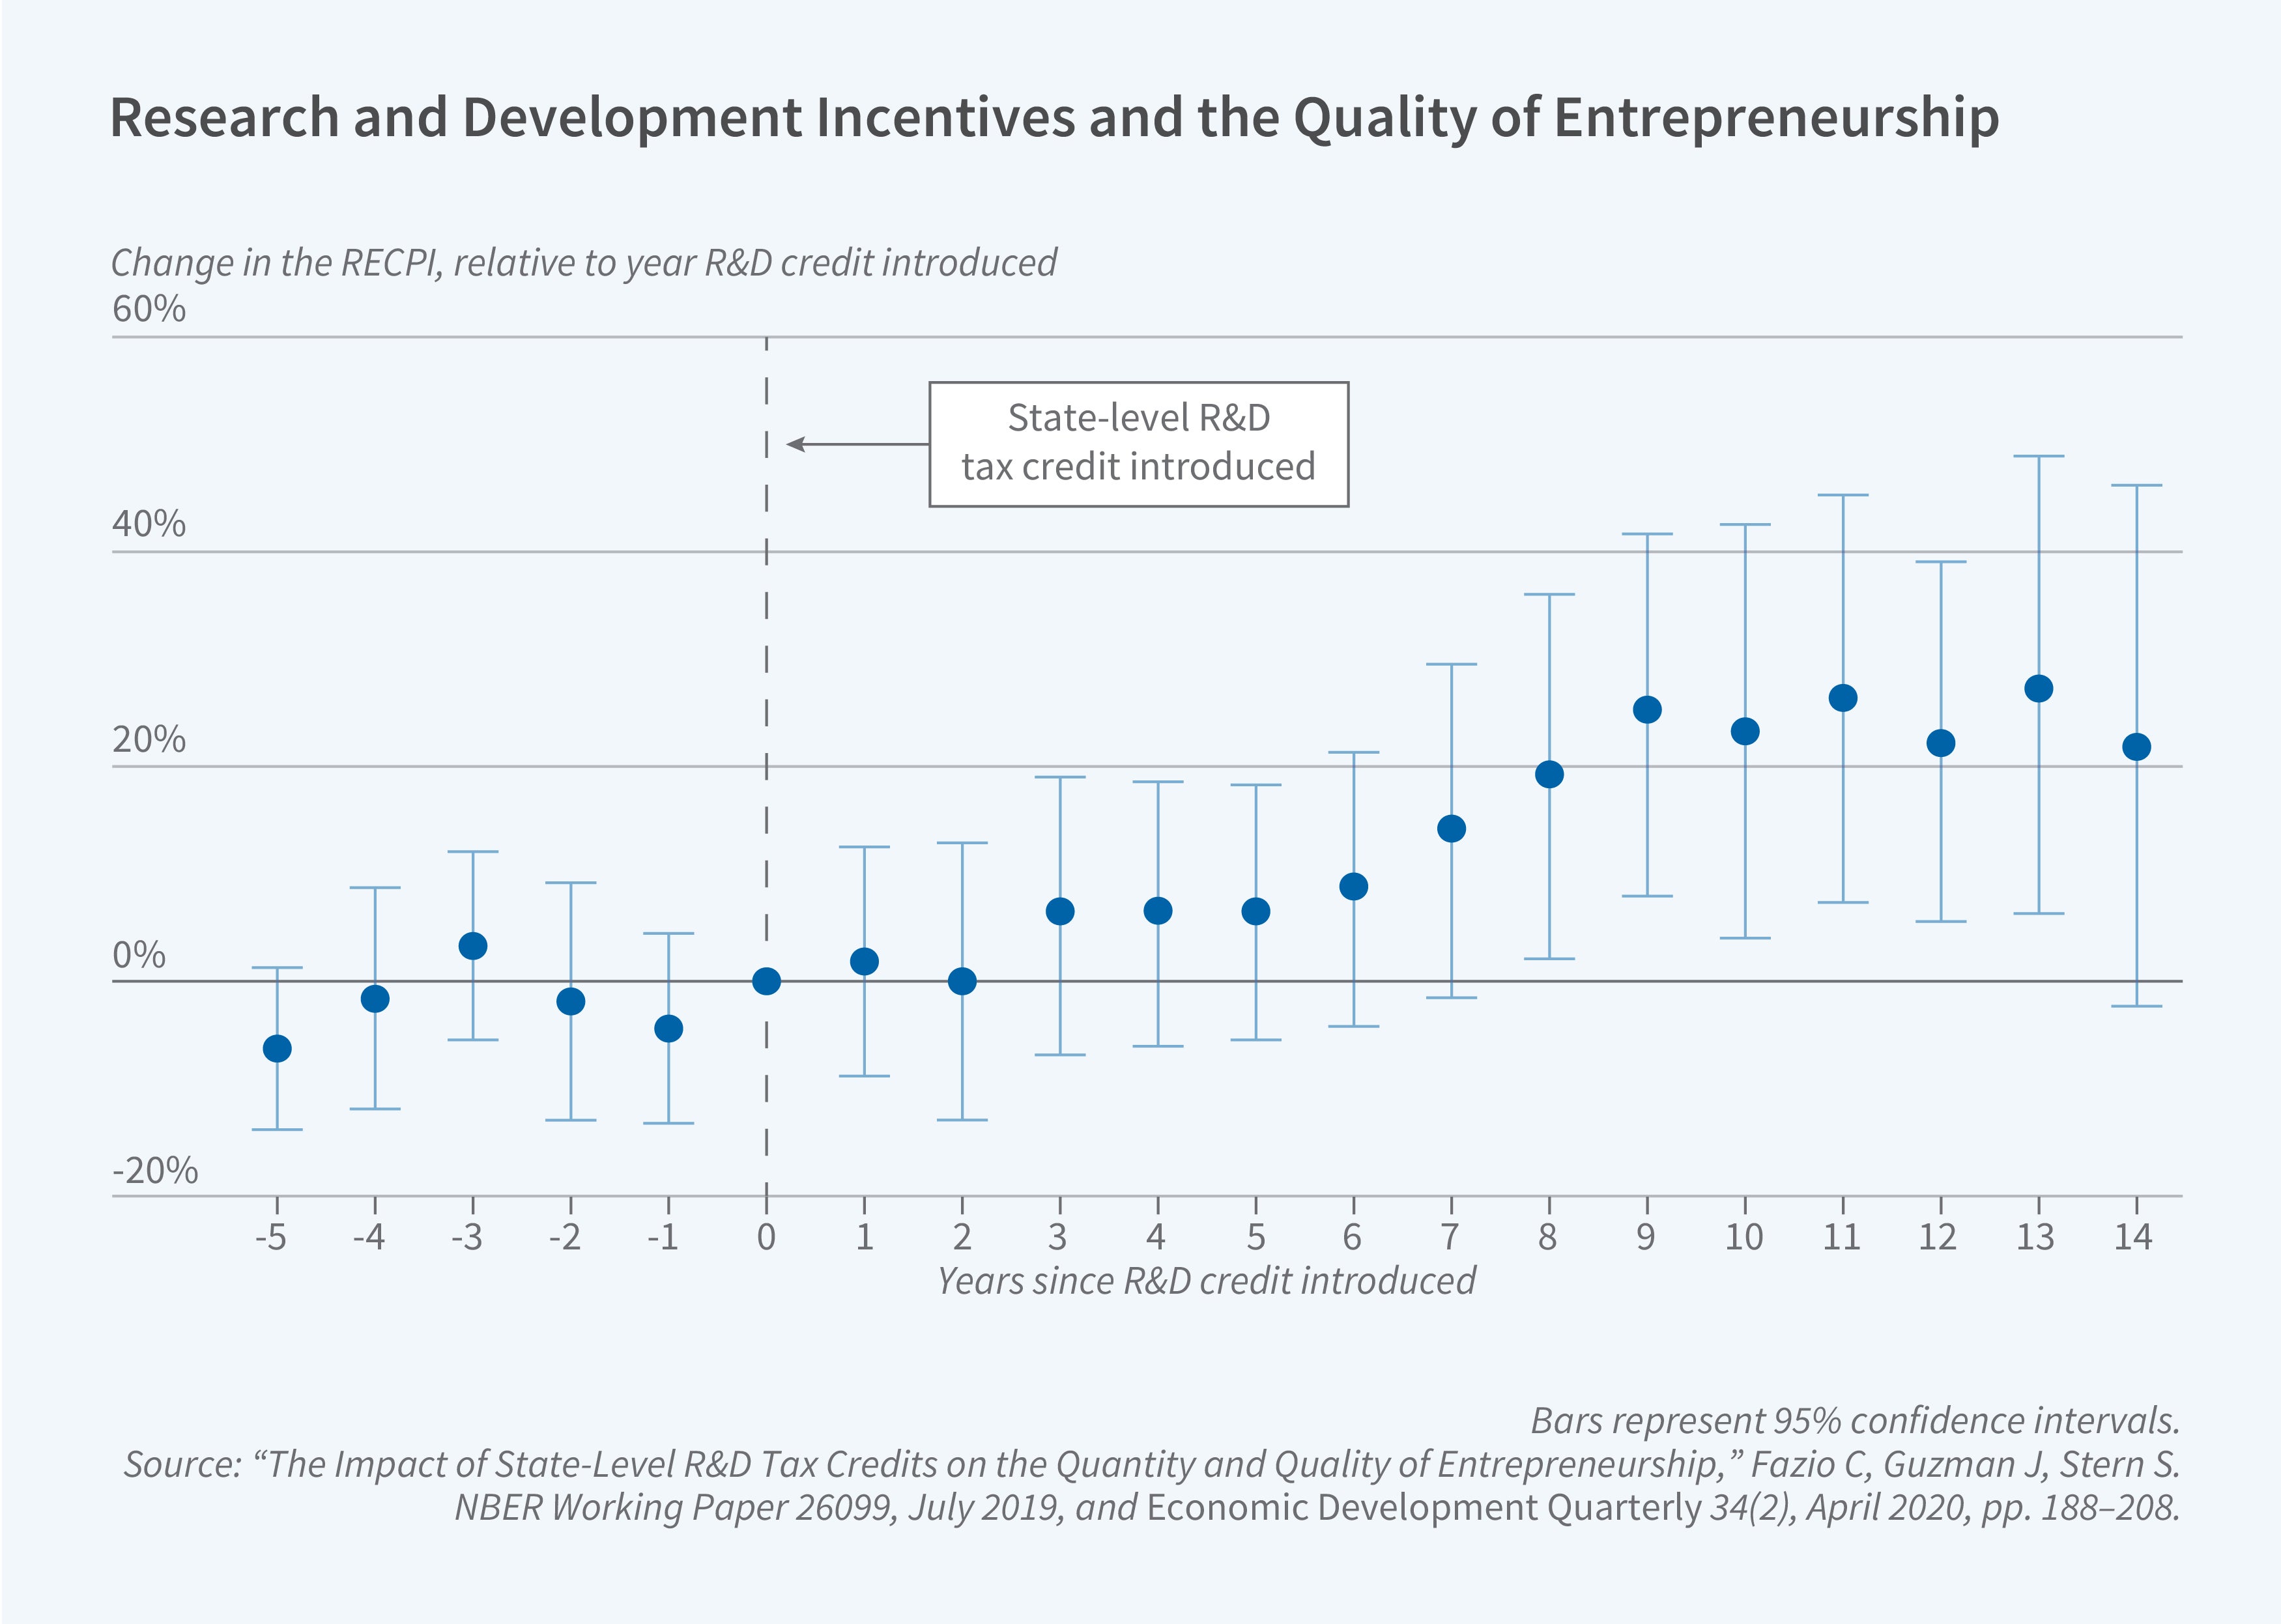
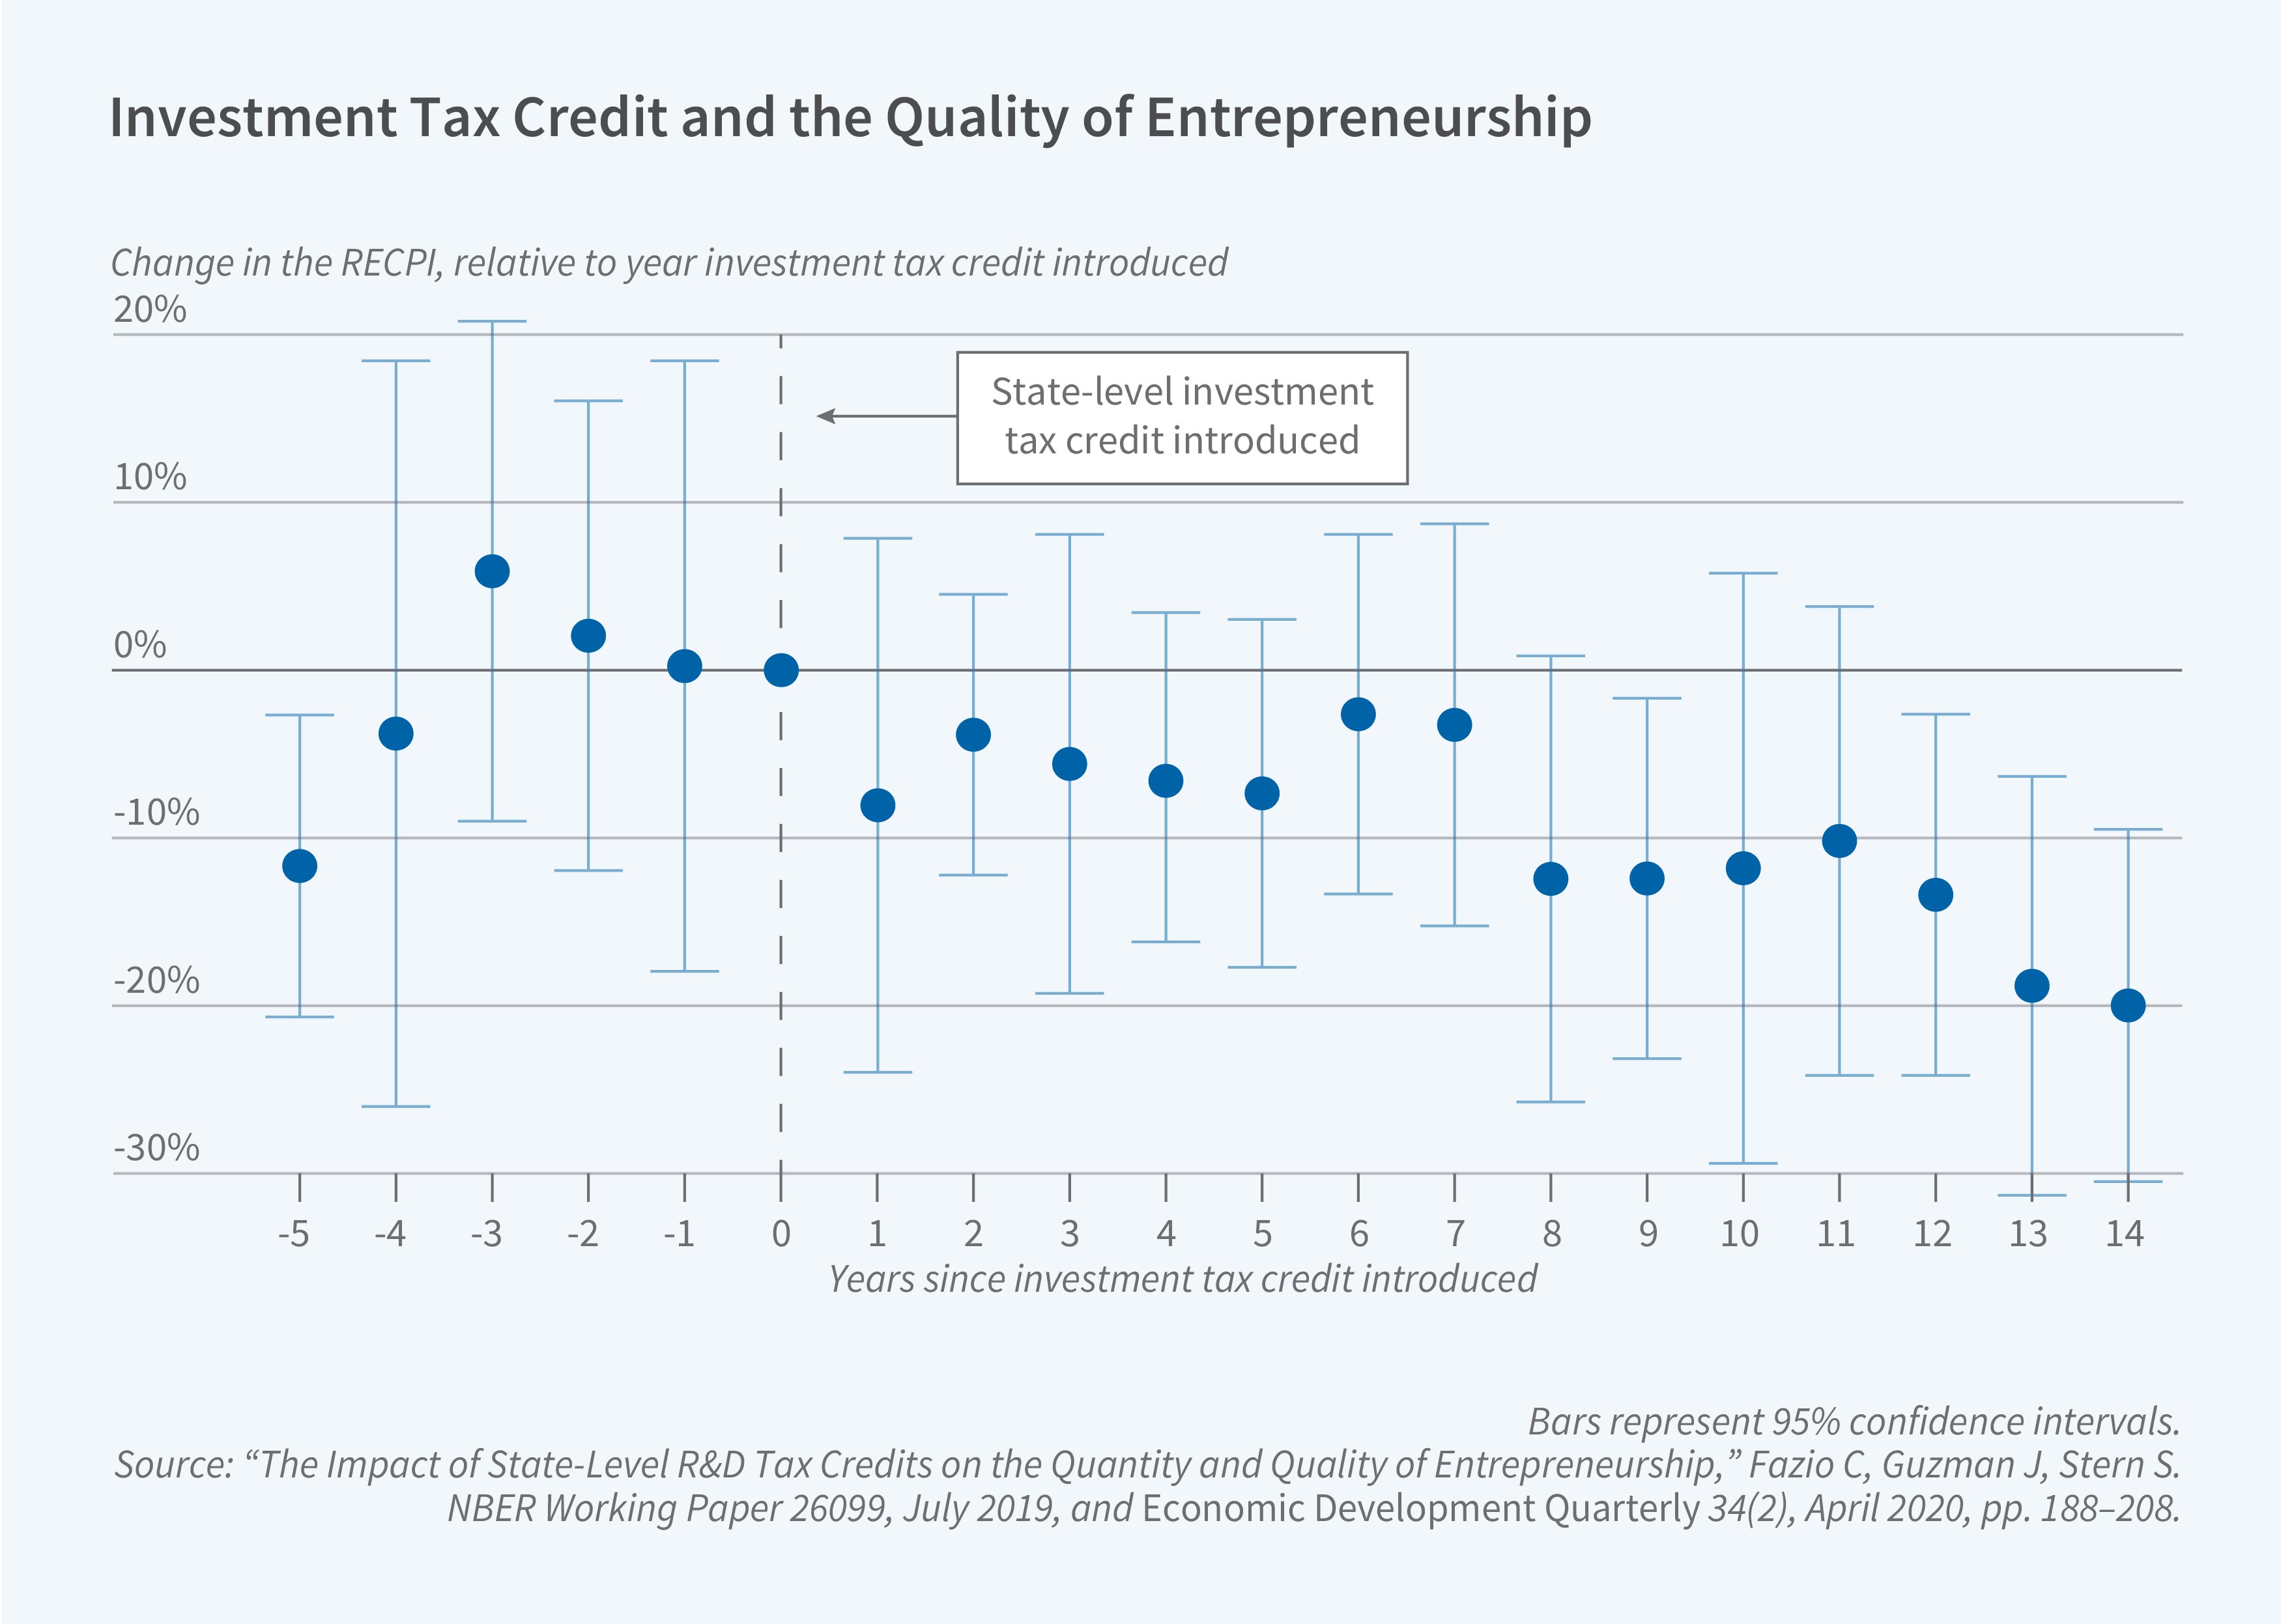
The SCP can be used to assess the impact of institutions, policies, and the broader economic environment on both the quantity and quality of entrepreneurship. For example, in “The Impact of State-Level R&D Tax Credits on the Quantity and Quality of Entrepreneurship,” we examine how the staggered rollout of different state-level tax credits, specifically, the R&D tax credit and the investment tax credit, impacts different types of entrepreneurship.8 Though the state-level R&D tax credit has largely been structured to enhance innovation expenditures by established organizations, which can use the credit to reduce their tax liability, the introduction of these credits increases both the quantity and the quality-adjusted quantity rate of entrepreneurship in equal proportion over time.9 We find an increase of about 20 percent over 10 years. However, the R&D tax credit does not seem to help startups realize growth outcomes at a higher rate. In contrast, the effect of the investment tax credit, which mostly helps established firms, is negative.
The data created under the SCP have been used to apply a similar approach to assessing a wide range of alternative institutions and policies. For example, Valentina Tartari and Stern leverage significant changes over time in federal government commitments to universities and national labs to document the impact of federal research expenditures at universities on the quality-adjusted quantity of entrepreneurship within that local university ecosystem.10 Other studies have used SCP data to understand how expanded opportunities for “gig” work affect local startup rates, the impact of angel tax credits on the quantity and quality-adjusted quantity of entrepreneurship, the persistence of entrepreneurial culture, and the impact of social networks and locations on the rate and composition of startup formation.11, 12, 13, 14
Real-Time Assessment
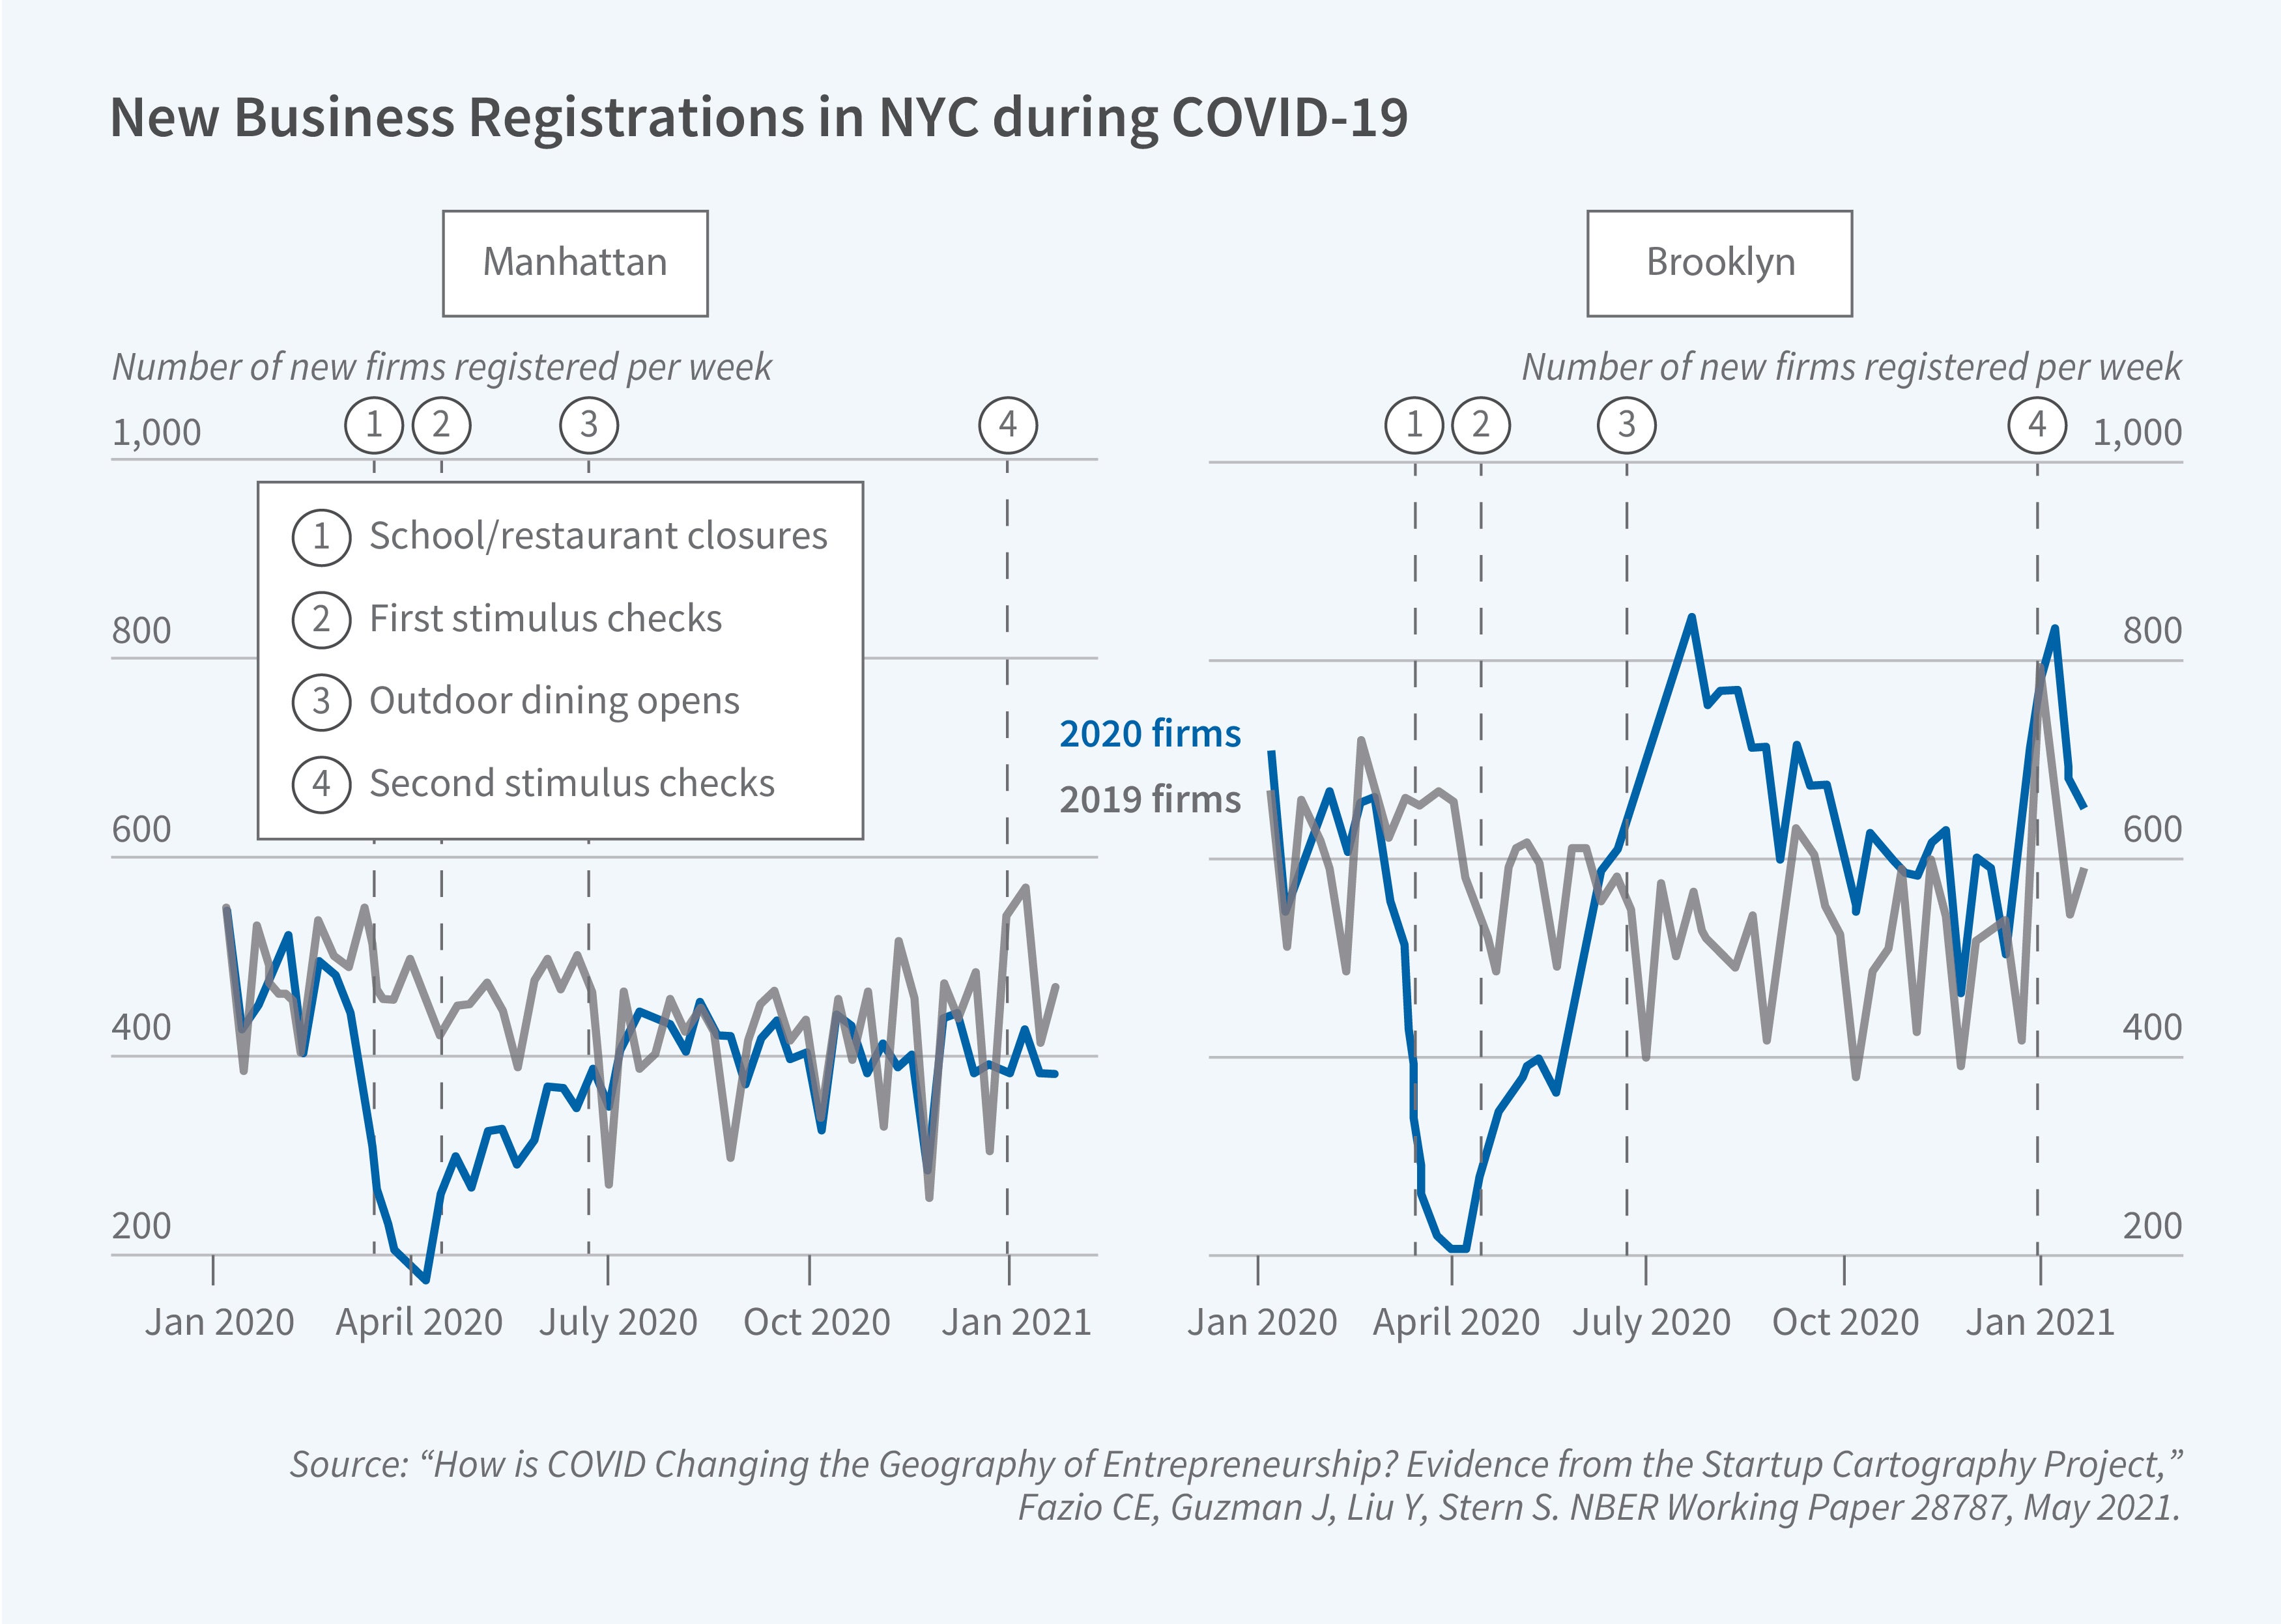
Since state-level business registration records are publicly accessible legal documents, it is possible, subject to cost and technology limitations, to use them to measure changes in entrepreneurial founding rates at a high level of granularity and on an almost real-time basis. For example, in the wake of the COVID-19 pandemic, we constructed descriptive but granular statistics for eight representative states to gain preliminary insight into how the pandemic and federal relief packages influenced the rate of entrepreneurship.15We found that lockdowns led to steep declines in the formation rate of new businesses, followed by a rapid recovery and rise in new business registrations beyond 2019 levels. We also found that the passage and implementation of major federal relief packages, such as the CARES Act, were associated with higher startup formation rates. Strikingly, new local businesses, not high-growth-potential firms, in higher-income predominantly Black neighborhoods drove this rebound and persistent recovery in startup formation.
Startup formation in 2020 relative to 2019 in New York City is illustrative. The recovery and expansion in startup formation in 2020 was centered in the Bronx and Brooklyn, while startup formation rates in lower Manhattan did not increase. This pattern highlights the potential of minority business enterprise to contribute to the United States’ economic recovery.
Entrepreneurship as a Lens on Perceptions of Economic Opportunity
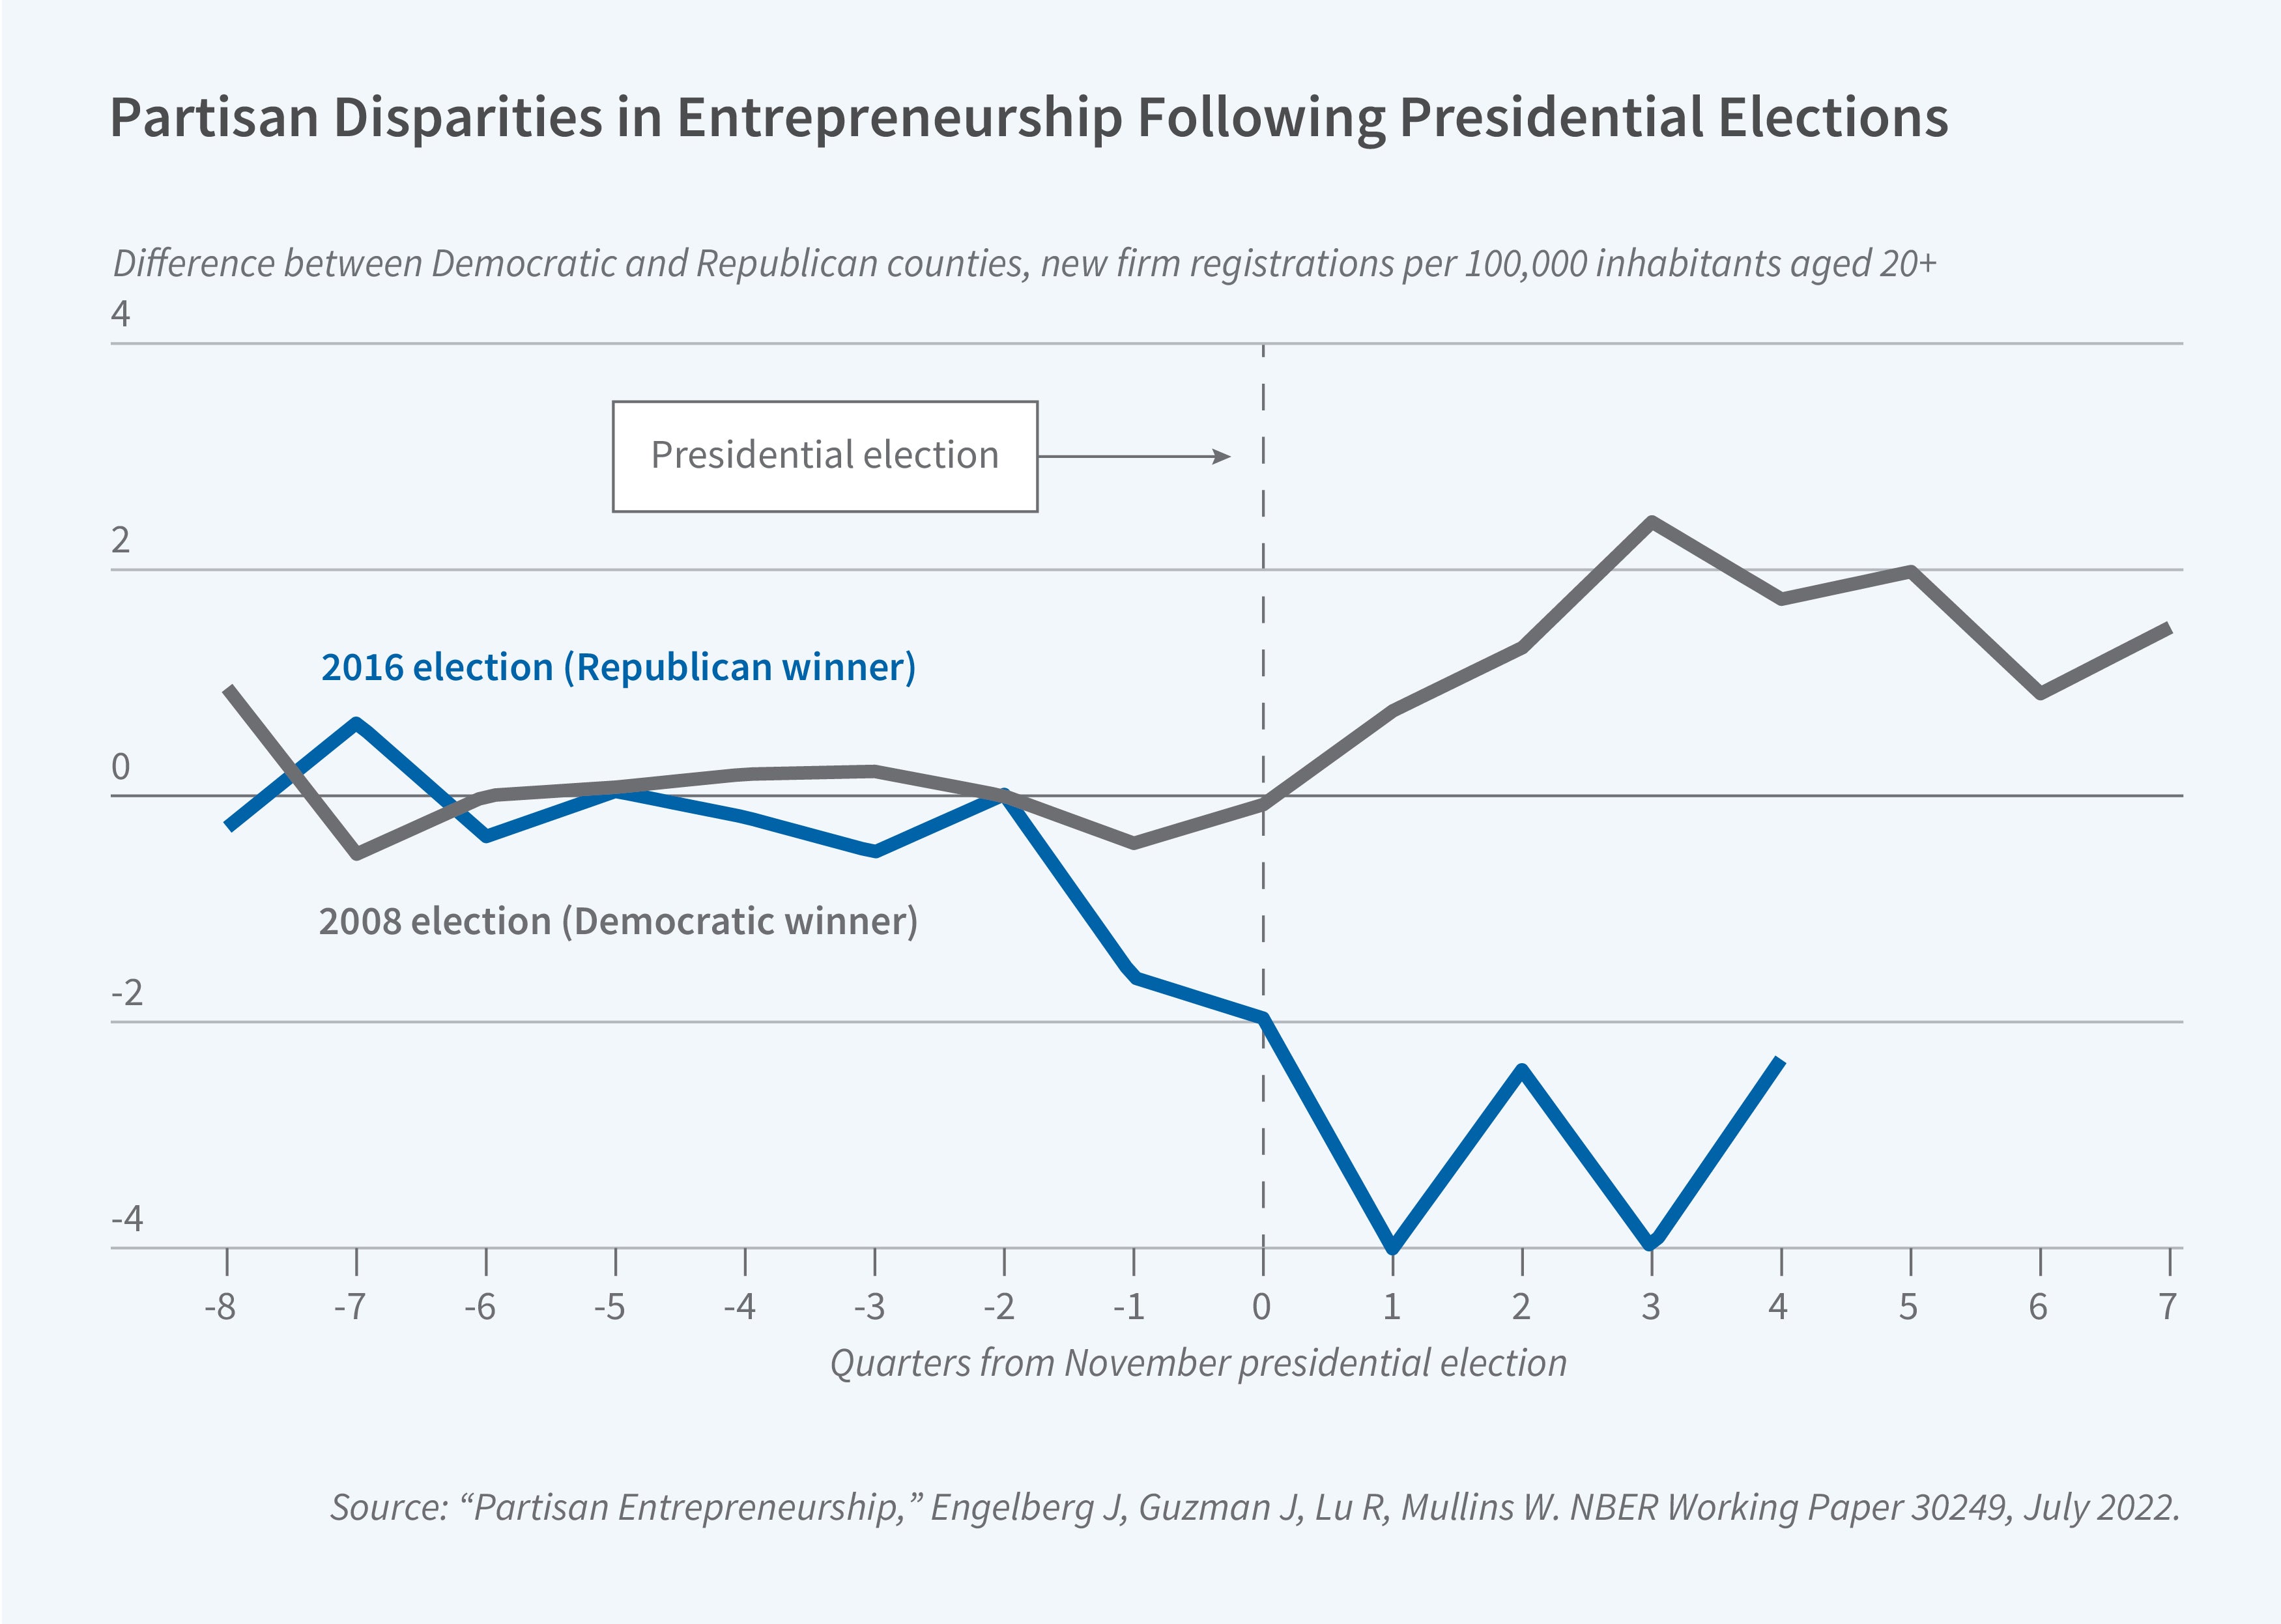
Beyond their utility as a measurement tool, granular and individualized data on startup choices can provide empirical insight into the behavioral drivers of entrepreneurship itself. With a team of collaborators, Guzman has analyzed whether individuals become entrepreneurs based on their own partisan beliefs about the future of the economy.16 While Republicans start more firms than Democrats in general, this “partisan gap” is time varying. Republicans increase their relative entrepreneurship during Republican administrations and decrease it during Democratic administrations, amounting to a partisan reallocation of 170,000 new firms over our 13-year sample. The strongest effects are centered on those who donate to campaigns and vote. These findings are consistent with emerging work emphasizing a “Bayesian” approach to entrepreneurship, in particular with the idea that a “favorable” election outcome induces a more optimistic assessment of opportunity and so results in more selection into entrepreneurship by partisans.
Conclusion and Future Directions
The SCP underscores the importance of accounting for high-growth potential in understanding entrepreneurship and using a more behavioral approach that centers around entrepreneurs’ choices. We hope to integrate these insights into a more holistic view of entrepreneurial policy and interventions; this is reflected in our recent work on regional innovation ecosystems and the stakeholder-based approach that leads to them.17 We also plan to perform a higher level of integration of additional granular and intermediate firm-level data sources, such as ORBIS, and to apply advanced analytical techniques to assess the impact of specific strategic interventions in regional innovation ecosystems as the startups they seek to seed attempt to scale. These advances will allow us and others to continue to explore the intersection of entrepreneurship, policy, and economic development, with a particular focus on the industry clusters that fuel regional innovation, the potential for entrepreneurship to drive inclusive growth, the influence of the social and political environment on shaping the choice to become an entrepreneur, and the impact of entrepreneurship on broader economic and social outcomes.
Endnotes
“The Role of Entrepreneurship in US Job Creation and Economic Dynamism,” Decker R, Haltiwanger J, Jarmin R, Miranda J. Journal of Economic Perspectives 28(3), Summer 2014, pp. 3–24.
“How Resilient Is Venture-Backed Innovation? Evidence from Four Decades of US Patenting,” Howell ST, Lerner J, Nanda R, Townsend RR. NBER Working Paper 27150, October 2023.
“Innovation Economics. Where Is Silicon Valley?” Guzman J, Stern S. Science 347(6222), February 2015, pp. 606–609.
“Nowcasting and Placecasting Entrepreneurial Quality and Performance,” Guzman J, Stern S. NBER Working Paper 20954, February 2015, and in Measuring Entrepreneurial Businesses: Current Knowledge and Challenges, Haltiwanger J, Hurst E, Miranda J, Schoar A, editors, pp. 63–109. Chicago, IL: University of Chicago Press.
“A New View of the Skew: Quantitative Assessment of the Quality of American Entrepreneurship,” Fazio C, Guzman J, Murray F, MIT Innovation Initiative Laboratory for Innovation Science and Policy, February 2016.
“The State of American Entrepreneurship: New Estimates of the Quantity and Quality of Entrepreneurship for 32 US States, 1988–2014,” Guzman J, Stern S. American Economic Journal: Economic Policy 12(4), November 2020, pp. 212–243.
“The Startup Cartography Project: Measuring and Mapping Entrepreneurial Ecosystems,” Andrews RJ, Fazio C, Guzman J, Liu Y, Stern S. Research Policy 51(9), November 2022, article 104581.
“The Impact of State-Level R&D Tax Credits on the Quantity and Quality of Entrepreneurship,” Fazio C, Guzman J, Stern S. NBER Working Paper 26099, July 2019, and Economic Development Quarterly 34(2), April 2020, pp. 188–208.
“The Impact of State-Level R&D Tax Credits on the Quantity and Quality of Entrepreneurship,” Fazio C, Guzman J, Stern S. NBER Working Paper 26099, July 2019, and Economic Development Quarterly 34(2), April 2020, pp. 188–208.
“More Than an Ivory Tower: The Impact of Research Institutions on the Quantity and Quality of Entrepreneurship,” Tartari V, Stern S. NBER Working Paper 28846, May 2021.
“Launching with a Parachute: The Gig Economy and New Business Formation,” Barrios JM, Hochberg YV, Yi H. NBER Working Paper 27183, May 2020, and Journal of Financial Economics 144(1), April 2022, pp. 22–43.
“Regional Crowdfunding and High Tech Entrepreneurship,” Yu S, Fleming L. Research Policy 51(9), November 2022, article 104348.
“Rugged Entrepreneurs: The Geographic and Cultural Contours of New Business Formation,” Barrios JM, Hochberg Y, Macciocchi D. NBER Working Paper 28606, March 2021.
“Go West Young Firm: The Impact of Startup Migration on the Performance of Migrants,” Guzman J. Management Science, September 2023, https://doi.org/10.1287/mnsc.2023.4924.
“How Is COVID Changing the Geography of Entrepreneurship? Evidence from the Startup Cartography Project,” Fazio CE, Guzman J, Liu Y, Stern S. NBER Working Paper 28787, May 2021.
“Partisan Entrepreneurship,” Engelberg J, Guzman J, Lu R, Mullins W. NBER Working Paper 30249, July 2022.
“Accelerating Innovation Ecosystems: The Promise and Challenges of Regional Innovation Engines,” Guzman J, Murray F, Stern S, Williams HL. NBER Working Paper 31541, August 2023, and Entrepreneurship and Innovation Policy and the Economy 3(1), March 2024, pp. 9–75.


