Economic Incentives in Pay-for-Performance Programs
The Centers for Medicare and Medicaid Services (CMS) spends nearly $1 trillion per year on healthcare expenditures for Medicare beneficiaries. With such large payments to healthcare providers, CMS is concerned about promoting quality of care. Over the last few decades, it has created several programs that reward hospitals and other providers financially for achieving measurable outcomes.1,2 These are commonly known as pay-for-performance, or P4P, programs. Their goal is to give providers larger financial payments in the future if current quality measures are high or improving.
The economic issues addressed in P4P programs are challenging. Without any quality incentives, there is concern that providers would strive to increase the quantity of care without regard to quality, leading to higher total outlays but not necessarily health improvement. To combat this moral hazard problem, CMS wants to link payments in part to quality of care. The challenge is to make financial incentives large enough to encourage improvements but not so large as to cause other distortions. In addition, if the P4P programs were too punitive to low-performing providers, the programs could lead to hospital closures, potentially lowering access to care in already underserved areas.
My research is about the economic incentives in Medicare’s P4P programs. In particular, I am interested in measuring financial incentives at the patient level to see if the distribution of these incentives is related to hospital-level characteristics, and in discovering whether changes in quality over time are related to the incentives. The fundamental assumptions of P4P programs are that providers have financial incentives to improve care and that they respond to those incentives. My research tests those assumptions.
Moneyball in Medicare
My interest in P4P programs in healthcare goes beyond studying whether these programs change quality of care or spending after implementation. Such an analysis could be done with a difference-in-differences empirical analysis. Instead, I am primarily concerned with understanding the economic incentives in the programs and whether they align with the goals. Most of my research on this topic has focused on Medicare’s Hospital Value-Based Purchasing (Hospital VBP) program.
The Hospital VBP program measures outcomes in four broad domains: patient experience, clinical outcomes, mortality and safety, and episode spending, defined as any healthcare spending between the admission that launches the episode and 30 days post-discharge. The program is important because nearly 3,000 general hospitals participate in it, and up to 3 percent of a hospital’s future Medicare reimbursement depends on its performance each year.
Jun Li, Anup Das, Lena Chen, and I tested the two fundamental assumptions of P4P for the Hospital VBP program.3 First, how large are the financial incentives? This turns out to be hard to estimate because the incentives vary by domain and across patients as well as across hospitals. Heterogeneity is an important feature of these incentives. We established that Medicare payment for one patient hospitalization is not just the diagnosis-related group (DRG) payment, as it was prior to Hospital VBP, but now includes a marginal future reimbursement equal to how that patient’s outcomes affect the hospital’s VBP score, rating, and future payment where treatment occurred. Simply put, a hospital’s total Medicare reimbursement for one patient is the sum of its current DRG payment and the discounted marginal future reimbursement based on how that patient’s outcomes affect the future bonus.
For example, take the mortality domain, which measures 30-day mortality for acute myocardial infarction, heart failure, and pneumonia. A patient’s outcome affects the mortality rate, which affects the number of points received for the mortality measure, which affects the total score across all domains, which affects the bonus percentage, which affects future Medicare reimbursement for the hospital. The hospital’s future reimbursement is affected by whether the patient lives or dies.
When we calculated the change in future annual Medicare payments at the hospital level due to a hypothetical patient death, we found that the marginal effect on future reimbursement was not always negative, as we expected it would be. Instead, we found that it was zero for about one-third of hospitals. Due to the complex nonlinear incentives, a sizable fraction of hospitals faced no penalty for worsening mortality. Similarly, they received no financial benefit if they improved mortality slightly. For hospitals with nonzero incentives the median financial benefit for avoiding a patient death was less than $10,000. For a few hospitals the value was larger, sometimes as much as $40,000.
The heterogeneity in mortality incentives was similar to what we found in other domains. Improving the quality of current patient outcomes had no effect on marginal future reimbursements for the hospitals that treated between a quarter and a third of patients. P4P in practice has a wide range of financial incentives across hospitals, with a sizable fraction facing no meaningful financial incentive to improve quality of care at the margin.
We also tested the second P4P assumption, which is that hospitals respond to the incentives. There were several reasons to be skeptical of hospital responses, beginning with the fact that there is a lag of about two years between quality measurements and the application of bonuses or penalties. Also, clinical personnel making treatment decisions do not directly receive any financial rewards, and professional norms promote quality even without financial incentives. Finally, the amount of the bonus or penalty might be too small to affect behavior. Despite such concerns, the entire premise of P4P is that the way to achieve better quality of care is to pay hospitals to improve.
Our evidence supports the presence of some behavioral response.4 We tested whether the year-over-year change in each quality measure was related to the marginal future reimbursement — technically, the marginal change in the total performance score given a one decile change in that measure, a measure of the magnitude of the incentive. Of the 15 measures we tested, seven were statistically significant and of the expected sign.
Our framework can be used to analyze any of the P4P programs, not just Hospital VBP. It remains an open question whether the same results would be found in, for example, the Hospital Readmissions Reduction Program or the Hospital-Acquired Condition Reduction Program.
Heterogeneous Treatment Effects
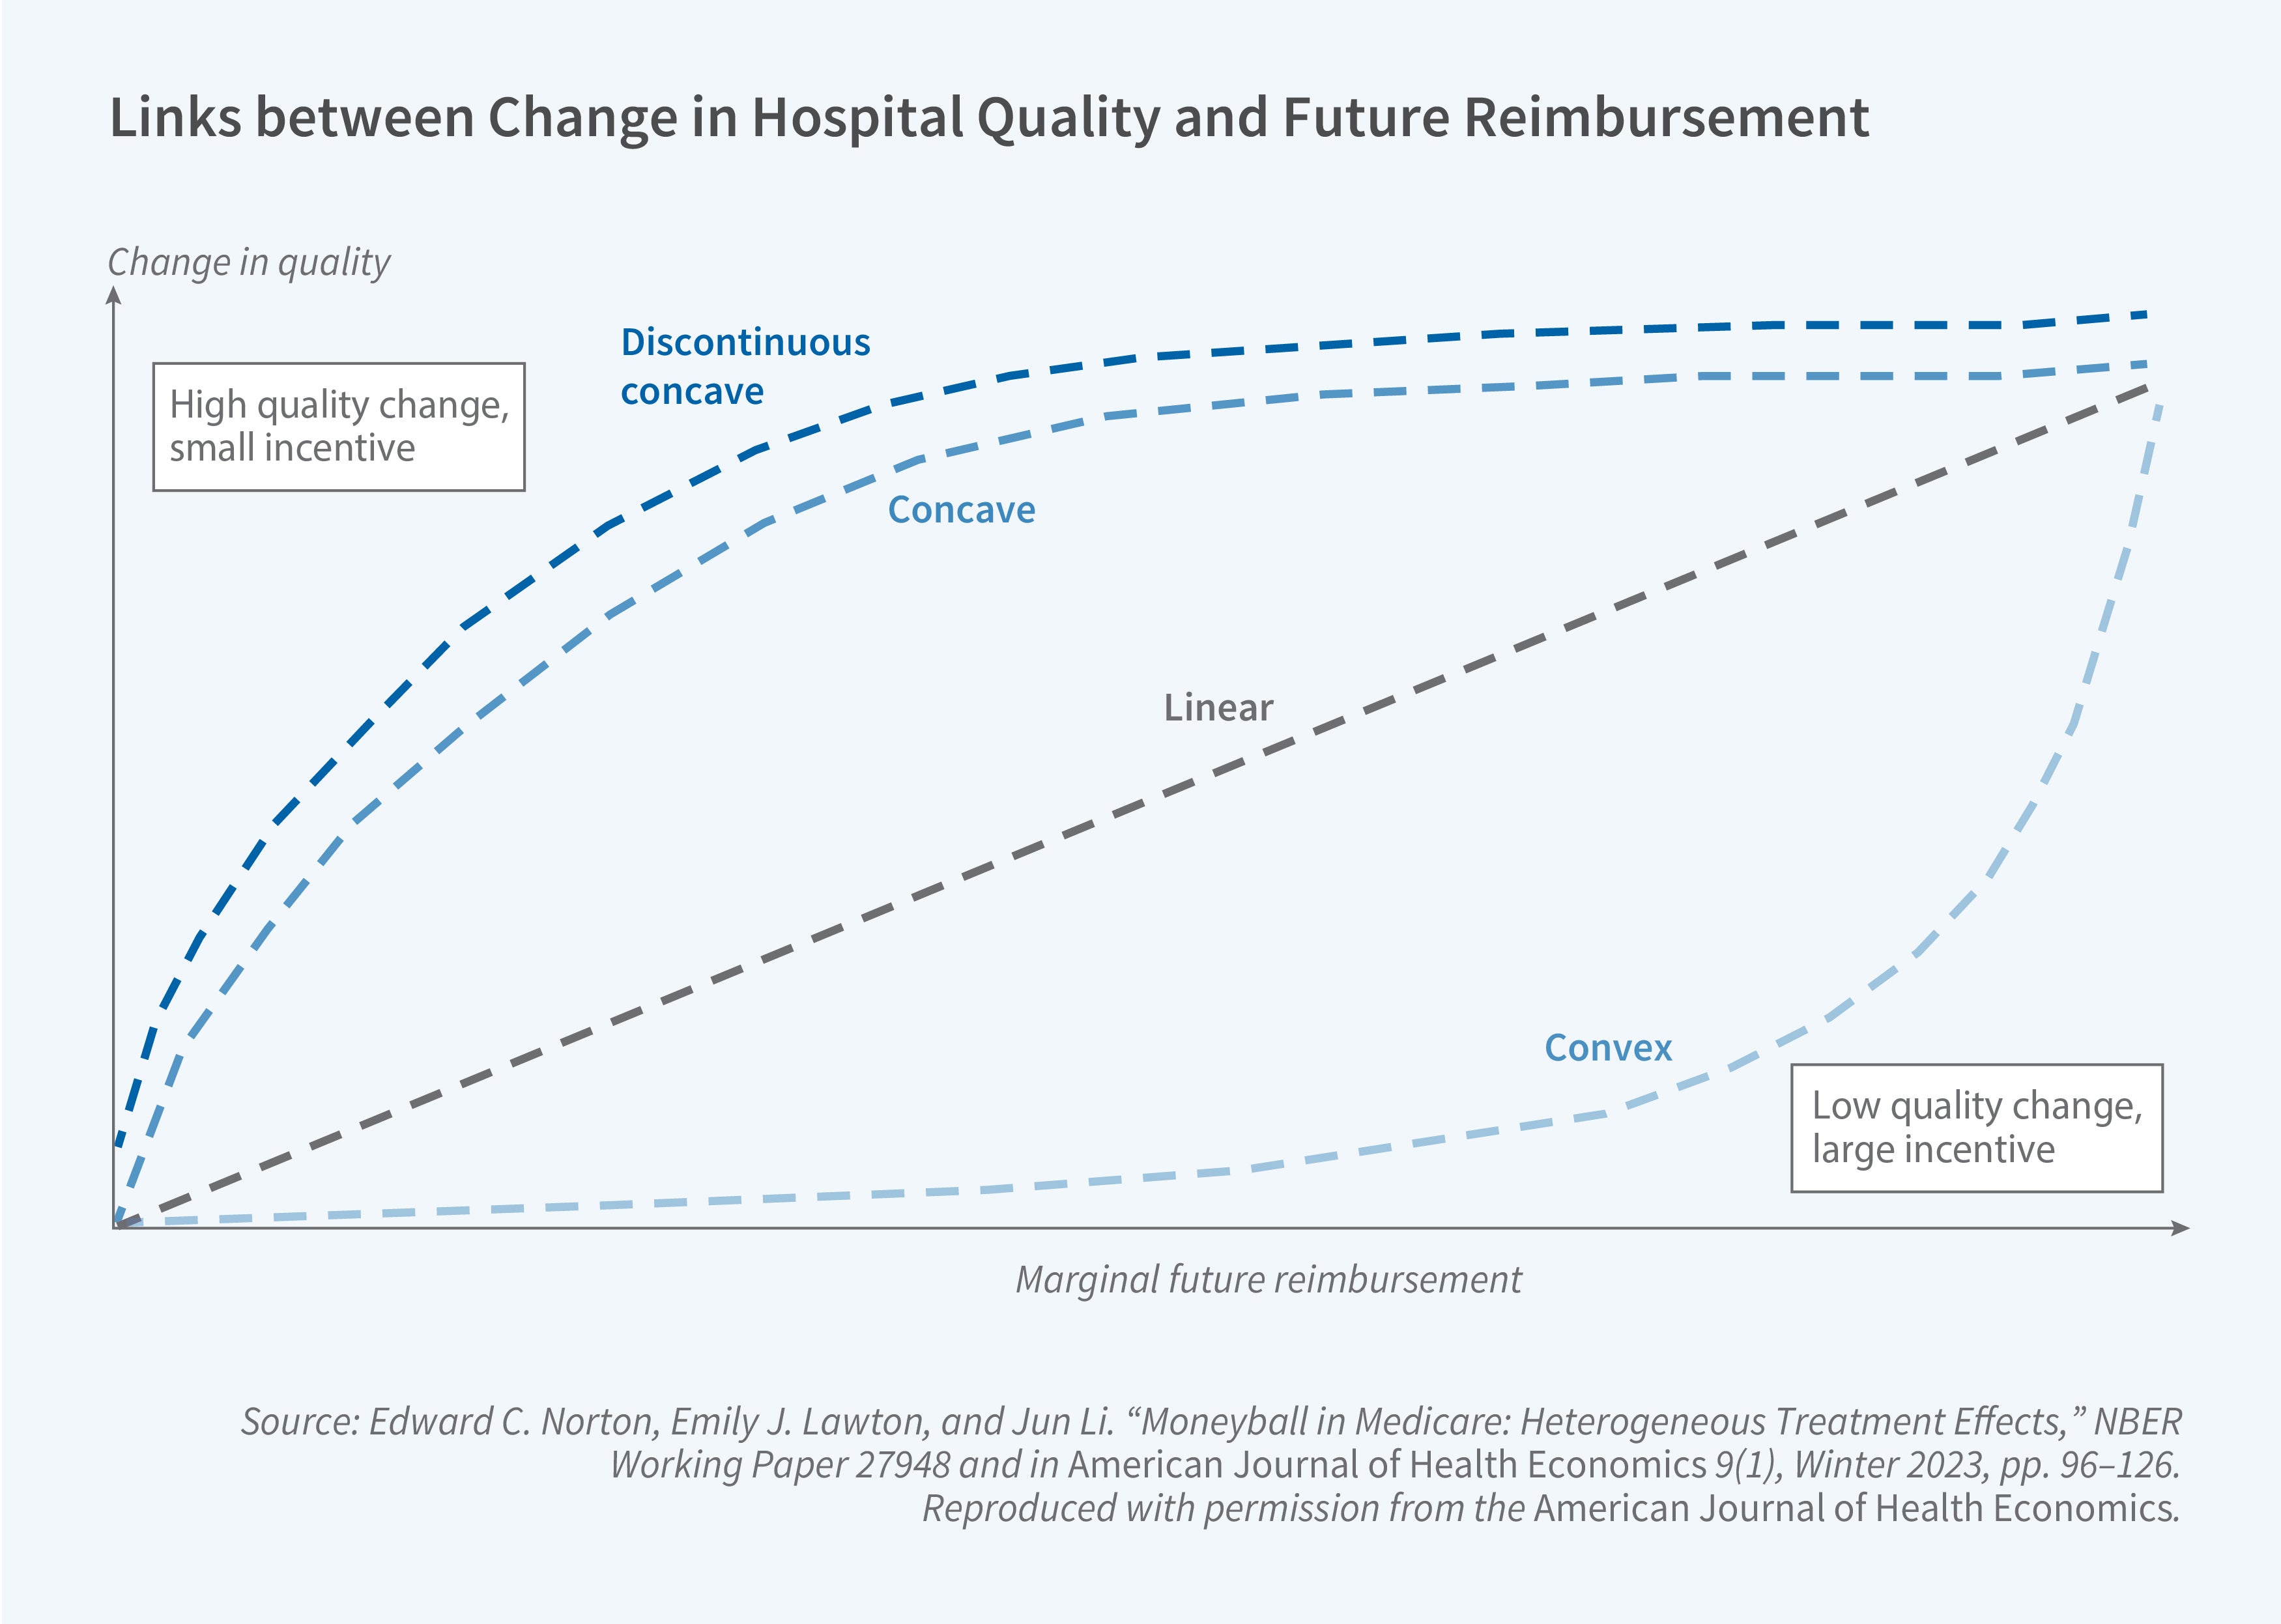
While our original research established a relationship between marginal financial incentives and year-over-year improvement in measures, the exact nature of the relationship was unclear. Emily Lawton, Li, and I next turned our attention to measuring the functional form of the relationship between these two variables.5 This can reveal the cost-effectiveness of the Hospital VBP program. To visualize this relationship, imagine graphing the change in quality of care on the y-axis as a function of the marginal future reimbursement on the x-axis.
If the true relationship is along a straight line from the origin, then each hospital has the same ratio of marginal financial incentive to change in quality of care. Small incentives lead to small improvements in quality of care, and large incentives lead to proportionately larger improvements. To obtain a high return on its investment, CMS wants hospitals to be in the upper right corner of the graph, that is, to make large improvements in quality of care for a small financial incentive. In contrast, CMS wants to avoid paying large incentives and getting little or no change in quality in return, as represented by the lower left part of Figure 1.

Another possibility for the relationship could be a discontinuous jump at the origin, with small financial incentives discontinuously inducing modest increases in quality, and then perhaps a concave function for positive values. Finally, there can be no relationship at all if the program is too confusing or hospitals are focused on other issues. It could be that hospitals ignore the incentives and if by random luck they happen to improve measured quality of care anyway, then they are happy to collect their bonus payment. In that case, the hospitals would be scattered along the x-axis with no apparent relationship.
Empirically we found that larger financial incentives induce better outcomes. However, this relationship is not linear. There is a large jump at zero when the incentives become positive. The large discontinuous jump implies that small positive incentives can induce hospitals to improve quality of care. This is the more cost-effective side of the figure.

Hospital VBP Values Quality over QALYs
Unlike P4P programs that target a single outcome, the Hospital VBP program measures a broad range of outcomes, from patient satisfaction and clinical outcomes to mortality and spending. Li, Das, Andy Ryan, Chen, and I explored the economic ramifications of the trade-offs implicit in such a composite measure.6 The Hospital VBP program converts scores on many quality measures into points and ultimately into dollars. The formulas that make that conversion are production functions. Patient outcomes create points. A hospital can earn more points either by doing better on, say, the patient heart attack mortality rate or on total episode spending.
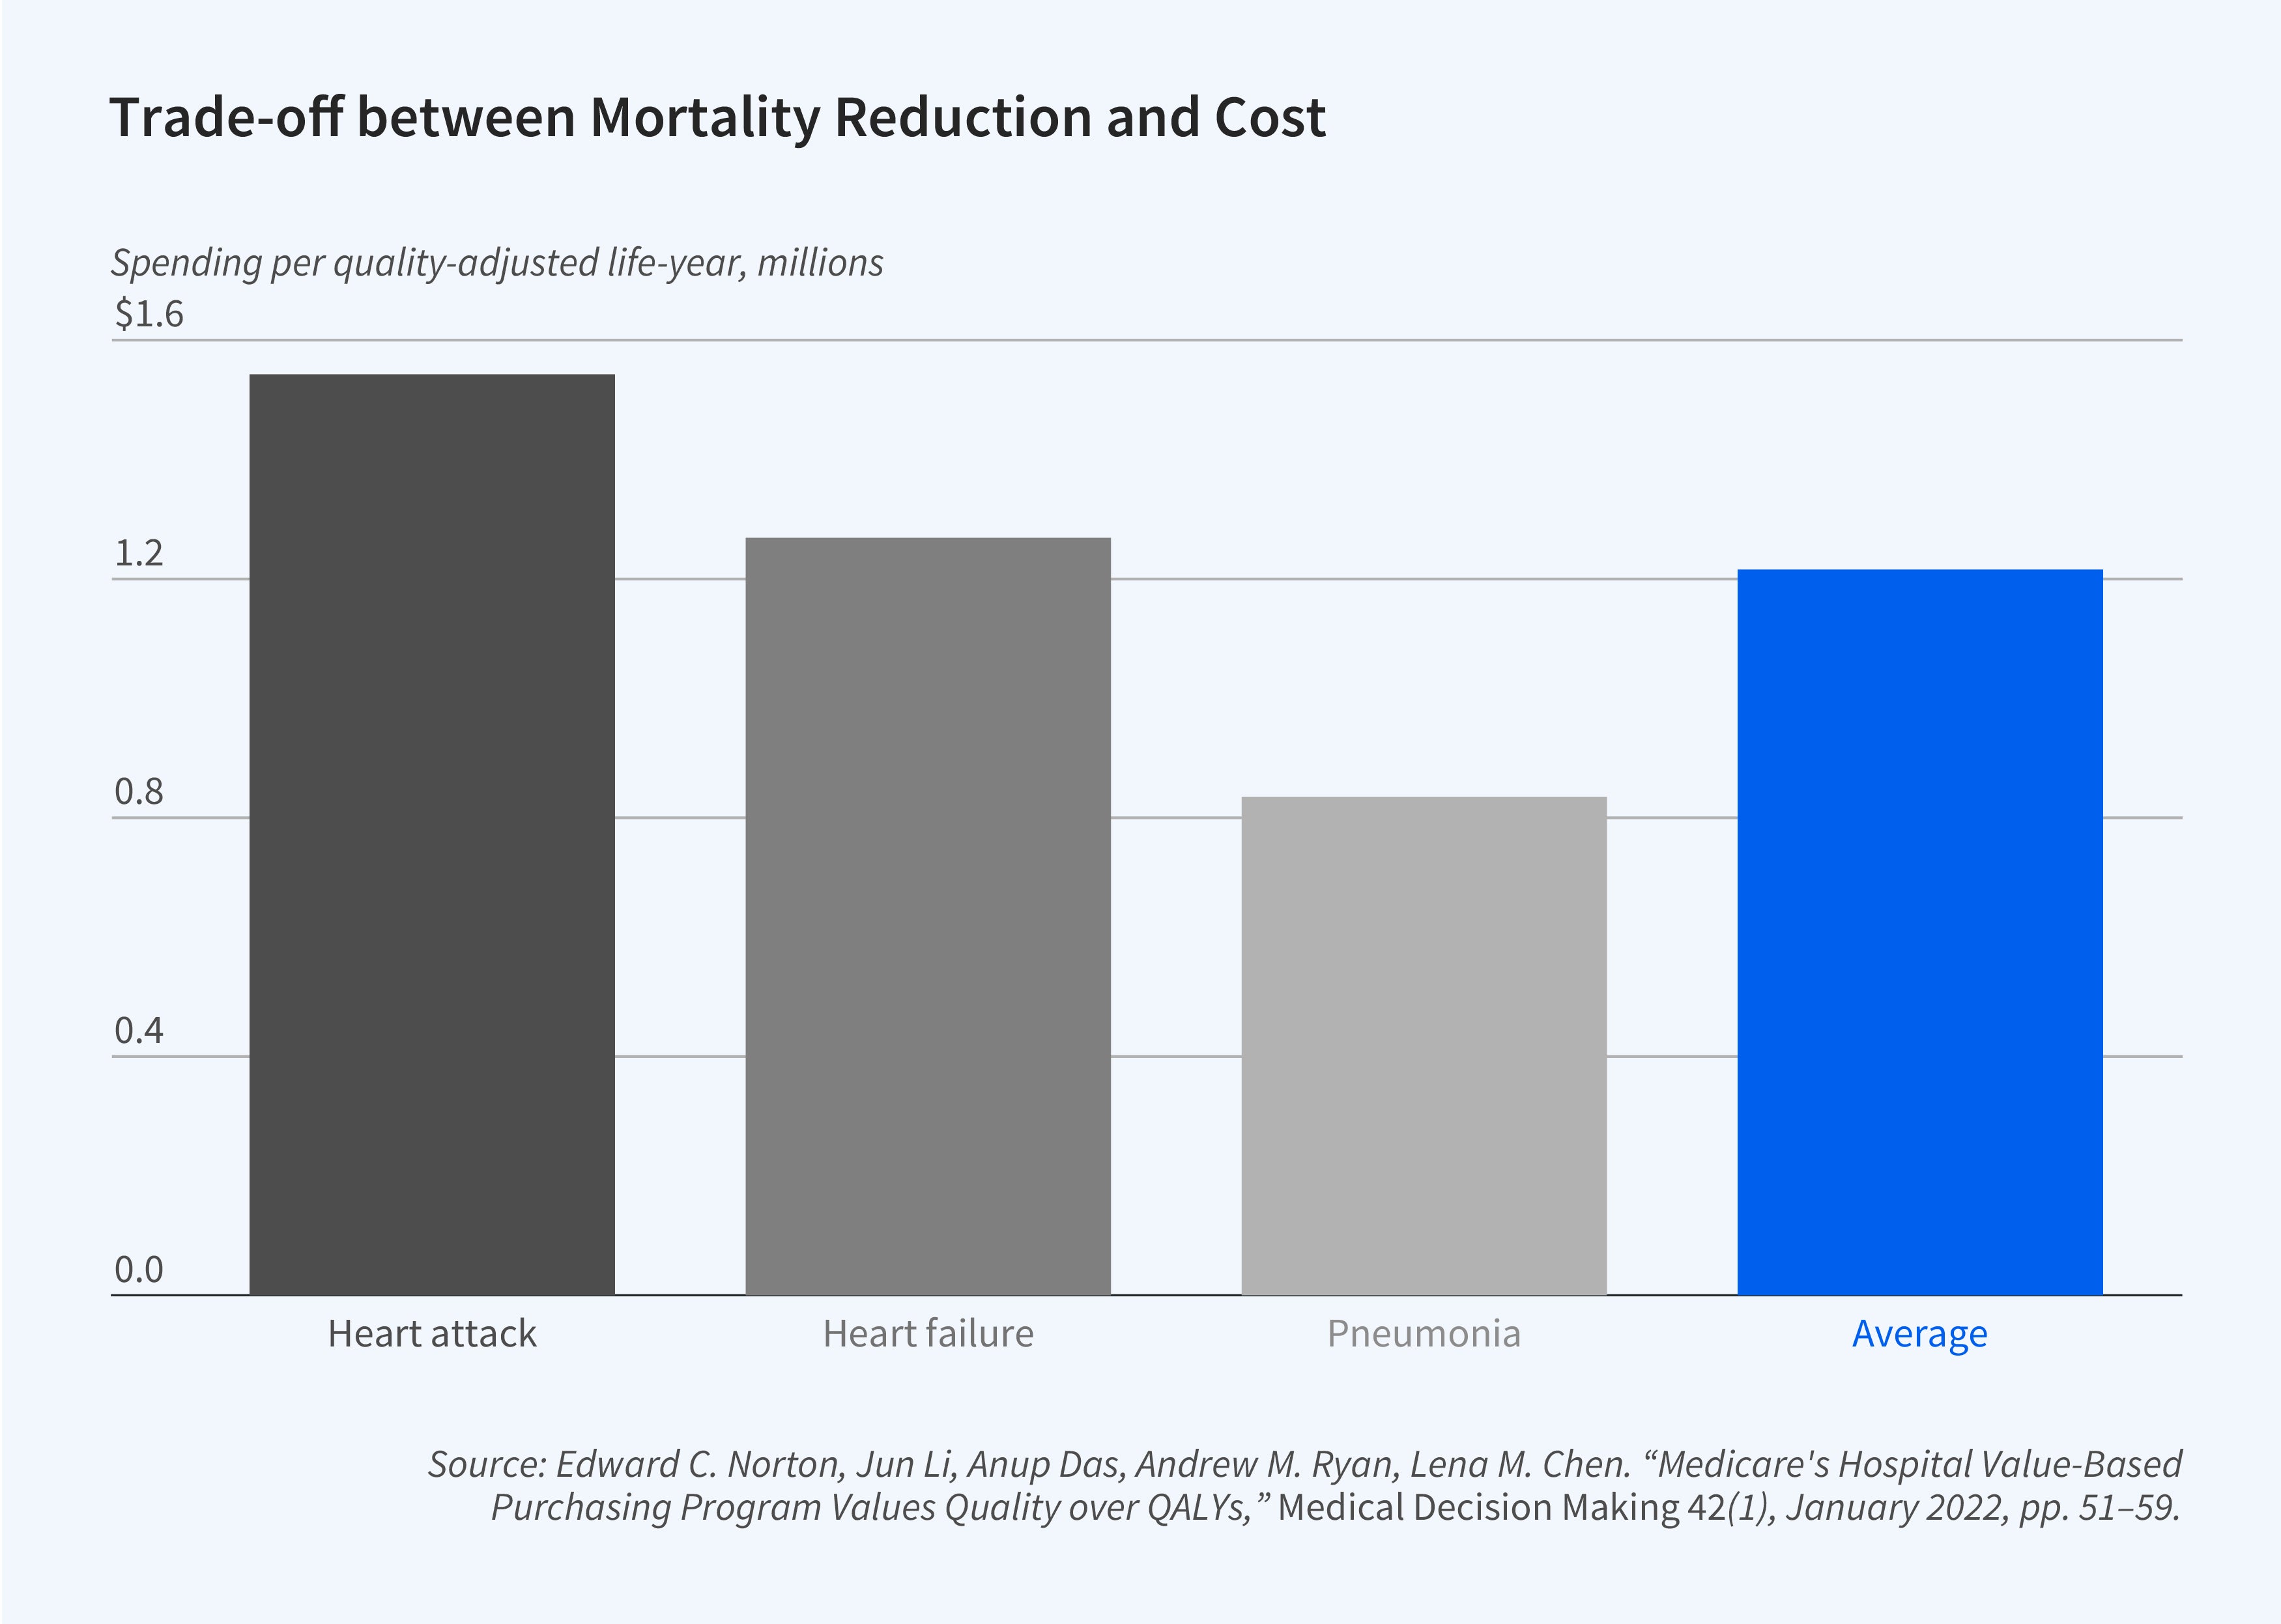
We were interested in estimating the magnitude of the trade-off between improved mortality and lower spending. An optimizing hospital has a choice, at the margin, of lowering the mortality rate or spending less to earn the same number of points. When seen as a production function, the Hospital VBP program implicitly trades off between lives and dollars, and we calculated that trade-off. What is the improvement in mortality necessary to earn points, and what is the corresponding improvement in spending needed to earn the same number of points?
Quality of care is often measured in quality-adjusted life-years (QALYs), where a QALY is a measure of the quality and quantity of life lived, with 1.0 QALY being one full year of life in perfect health. The commonly accepted range for medical interventions is roughly $50,000 to $200,000 per QALY. If incentives in the Hospital VBP program are balanced, then the trade-off between spending improvement and mortality improvement measured in QALYs should be in this range.
We estimate the total value of Medicare savings divided by the equivalent total of QALYs gained. These findings imply that the value of the mortality reduction in the Hospital VBP program is $1,542,837 per QALY for heart attack, $1,268,827 per QALY for heart failure, and $835,129 per QALY for pneumonia. The average across all three conditions is $1,215,598 per QALY. These numbers are several orders of magnitude higher than the accepted range, which suggests that the Hospital VBP program overvalues improvements in quality of care, relative to spending reductions, relative to what we judge to be the common accepted valuation metrics.
Endnotes
“Incentive Regulation of Nursing Homes,” Norton EC. Journal of Health Economics 11(2), August 1992, pp. 105–128.
“Do Report Cards Predict Future Quality? The Case of Skilled Nursing Facilities,” Cornell PY, Grabowski DC, Norton EC, Rahman M. NBER Working Paper 25940, June 2019, and Journal of Health Economics 66, May 2019, pp. 208–221.
“Moneyball in Medicare,” Norton EC, Li J, Das A, Chen LM. NBER Working Paper 22371, June 2016, and Journal of Health Economics 61, September 2018, pp. 259–273.
“Moneyball in Medicare: Heterogeneous Treatment Effects,” Norton EC, Lawton EJ, Li J. NBER Working Paper 27948, October 2020, and American Journal of Health Economics 9(1), Winter 2023, pp. 96–126.
“Medicare’s Hospital Value-Based Purchasing Program Values Quality over QALYs,” Norton EC, Li J, Das A, Ryan AM, Chen LM. Medical Decision Making 42(1), January 2022, pp. 51–59.


