Trends in Earnings Volatility among US Men
Economists have been concerned about the volatility of earnings and income for decades because it creates uncertainty for families and individuals and makes it more difficult for them to plan future consumption. Volatility may discourage investments financed by loans that have to be paid off by a future income stream. Education and training, which can be very costly at the college level, may be forestalled due to uncertainty about future earnings payoffs.
Sociologists and economists alike have shown that family income volatility has harmful effects on children and their development, especially younger children. Economists recognize that neither private insurance markets nor government programs like unemployment insurance can adequately protect individuals against most earnings risk. Consequently, those with sufficient income to forgo current consumption often attempt to self-insure by engaging in precautionary saving, but this is rarely enough to smooth future consumption in the face of significant volatility.
Whether earnings volatility has risen over time in the United States is an important question for economics and for government policy. One well-known development that may have led to such an increase is deindustrialization, which has reduced the number of stable, long-term blue-collar jobs and replaced them with jobs in the service sector, retailing, and other industries that often have high rates of turnover and unstable earnings. Some growing industries, like high tech, have several dominant firms and many smaller firms with high failure rates and intense competition, leading to unstable employment and earnings profiles for many individuals in those industries. But against these well-recognized forces has been a reduction in volatility at the macroeconomic level, commonly called the “Great Moderation.” That term was used to describe the reduction in macro-level volatility that began in the 1980s and ran through 2007.1
I have studied trends in the earnings volatility of US men for many years, beginning with my 1994 paper in the Brookings Papers on Economic Activity, coauthored with Peter Gottschalk.2 The focus of this initial work was on men because their jobs are more concentrated in manufacturing and other industries hit particularly hard by deindustrialization. We took data from a well-known household survey, the Panel Study of Income Dynamics (PSID), which is the longest-running panel household survey in the world. It started in 1968 and is ongoing. We used the data to track White men’s earnings from 1970 to 1987 — focusing on White men because of small sample sizes for other groups — and used very simple techniques to see if their earnings had become more unstable. We found that earnings volatility, measured as the standard deviation of the change in earnings from one survey wave to the next, rose dramatically over that period, particularly among less-educated workers. Volatility rose by 50 percent for high school graduates and 96 percent for high school dropouts. The disproportionate increase among those less educated suggested a potential role for deindustrialization. We also noted that the increase in volatility was partly responsible for the growth in cross-sectional earnings inequality, because higher levels of earnings volatility and “transitory shocks” in a given year increase the dispersion of earnings.
Work since the Gottschalk-Moffitt Study
Gottschalk and I continued to update our work periodically with data from the PSID, still focusing on men but including all racial groups. Contrary to expectations of a long-term trend, from 1987 through the mid-1990s there was no evidence of an upward or downward trend, although there were strong countercyclical fluctuations as volatility rose in recessions and fell during recoveries. We found that volatility began to rise again just before, and then especially during, the Great Recession of 2008–09. In a further update, Sisi Zhang and I found that volatility in 2014 was higher than at any previous time since 1970.3
Despite the unquestionable value for volatility studies of the PSID’s 50 years following men, it has some disadvantages as a dataset. One problem with all surveys that ask the same individuals their earnings periodically — biennially in the PSID — is that workers misremember their previous years’ earnings. This can make it appear as though earnings are fluctuating, when this is just a result of reporting error. Another problem with most panel surveys is that they suffer from attrition: individuals drop out. This could lead to surveys becoming less representative of the population over time.
Coinciding with these concerns with the PSID has been major growth in economics research in general using administrative data on earnings for the study of many issues, such as earnings inequality, poverty, and volatility. Researchers have gained access to earnings data held by the Social Security Administration, the unemployment insurance system, and the Internal Revenue Service. Because these earnings are reported by employers, they should be more accurate than survey responses. Indeed, some studies using administrative data have shown no increase in volatility or have even shown a decline.4
Cross Dataset Project
Several years ago, I began a project with several other economists — John Abowd, Christopher Bollinger, Michael Carr, Charles Hokayem, Kevin McKinney, Emily Wiemers, Zhang, and James Ziliak — to estimate earnings volatility trends of men (or all racial groups) with a number of datasets other than the PSID, including administrative datasets. We attempted to make our analyses as comparable as possible — calculating volatility the same way, selecting samples with similar demographic compositions, and generally using identical analytic methods.
In addition to updating the evidence from the PSID, the project brought three other datasets to bear on the question. Two of them used data from well-known household surveys that are intended to be representative of the US population: the Current Population Survey (CPS) and the Survey of Income and Program Participation (SIPP), both run by the US Census Bureau. In a key advance, the researchers using those data were able to link Social Security earnings data to the survey responses and therefore to compare these two reports on earnings. The third dataset used only administrative data, compiling earnings data from the unemployment insurance records in the Longitudinal Employer-Household Dynamics (LEHD) program. Unlike the other datasets, this one covers almost the entire US workforce and is not restricted to those who happened to participate in a survey like the CPS, SIPP, or PSID. Unfortunately, none of the other datasets are available as far back in time as the PSID (1968). The LEHD is the shortest data series; it is available only since 1998.5
The initial set of results from the project has appeared in several working papers.6 They address two separate sets of questions: First, do the different datasets show different patterns of volatility? Do the non-PSID datasets show the same trends as the PSID? Do the most recently released data from the PSID — for additional years — continue to show the same findings as these PSID patterns over earlier periods? And second, if there are differences in volatility patterns across the datasets, can those differences be explained? Can we reconcile the differences to arrive at a consensus estimate?
On the first set of questions, the different datasets often show very different levels of male earnings volatility. Figure 1 shows the measured volatility in all six data series — the PSID, the survey and administrative data from the CPS and the SIPP, and the LEHD. The vertical axis is the variance of the percentage change in earnings from one period to another so that, for example, a 15 percent value would mean that the standard deviation of percentage changes in earnings across the male working population is about 39 percent (the square root of 15 percent). The figure shows that the LEHD has much higher levels of earnings volatility than any of the other datasets, including the two administrative datasets matched to the CPS and SIPP surveys. Three of the data series — the two CPS series and the SIPP survey — have volatility levels less than half those in the LEHD. The other two data series — the PSID and the SIPP administrative data — lie between these extremes.
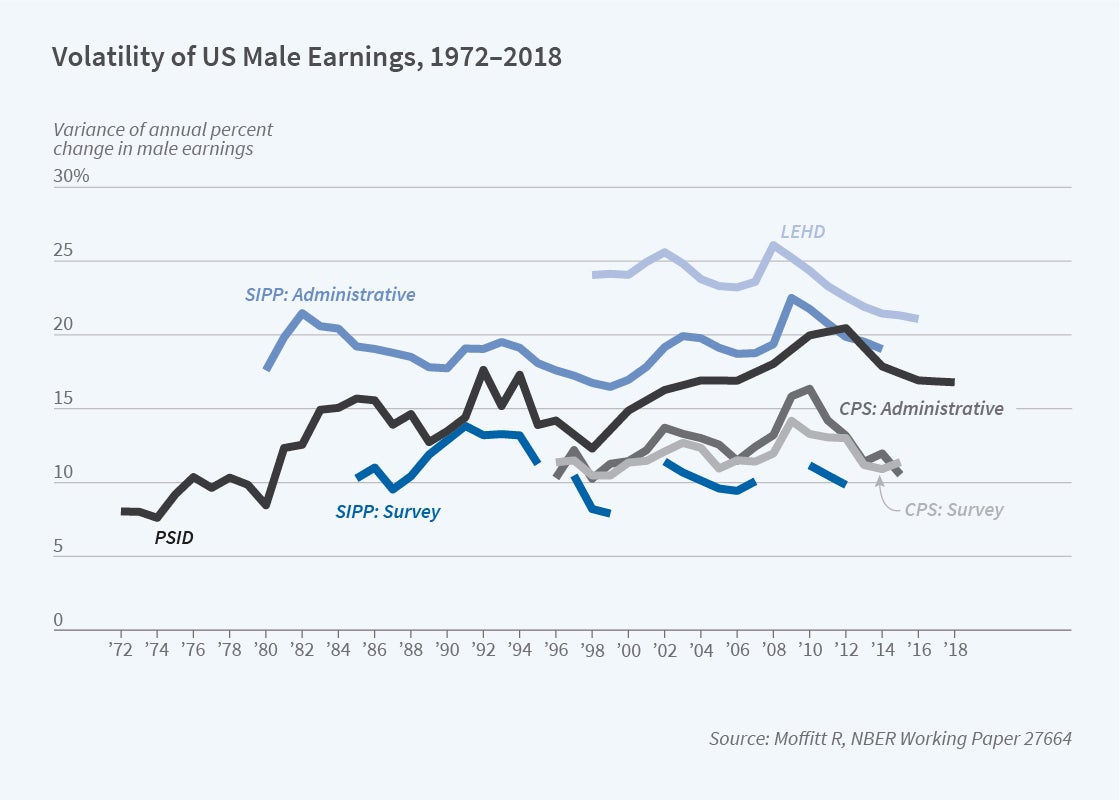
The trends in volatility are much more similar across the data series than the levels are, especially when the large increases in the late 2000s are treated as cyclical and are not interpreted as a trend. In the early years of the 1980s, the PSID shows the largest increase, but the two SIPP data series also show increases, although in rather different years. More importantly, all the data series available back to the 1980s show almost no trend from the mid-1980s to the late 1990s and early 2000s, consistent with much macroeconomic research on the Great Moderation. And after the early 2000s, when more datasets are available, no data series except possibly the PSID and the SIPP administrative data show much of a net trend if the last data point — at the end of volatility decline following the Great Recession — is used as the end point.
Nevertheless, visual detection of trends in data series that show fluctuations as large as those in some of the series is often difficult, and that is the case with Figure 1. This is made particularly difficult because trends in the second half of the time frame appear quite different if, say, 1998 is used as the starting point rather than 1992. Figure 2 attempts to address this issue by using as the base period a full business cycle in the late 1990s and early 2000s for each of the data series, and then calculating volatility growth relative to that base. The PSID still is an outlier, showing volatility growth similar to that of most of the other series through about 2010, but then not falling nearly as much as the others, although the new post-recession data points for the PSID show volatility to have fallen greatly from its 2012 peak. The remaining data series all indicate essentially zero net growth by the ends of the data samples, and the LEHD shows only a very small decline, occurring only after 2011.

The second set of questions asks whether any of the large differences in volatility levels, or any of the remaining small differences in trends, can be explained, and those differing results reconciled. The answer is yes. Our administrative datasets have a much larger left tail of the earnings distribution than our survey datasets — that is, larger fractions of men with low earnings. For example, 25 percent of the LEHD observations have annual earnings less than $20,000 in 2010 dollars but only 5 percent of PSID observations do. This pattern has been noticed in past work comparing survey to administrative data, with the most common hypothesis being that survey respondents often fail to report short duration or part-time jobs when reporting last year’s earnings.7
As part of the project, my colleagues and I conducted a simple exercise to estimate the impact of this difference on volatility: we benchmarked the earnings distributions in all our data series to the PSID distribution, reweighting the data to have the same distribution as that in the PSID. This down-weighted observations with low earnings. As Figure 3 shows, this dramatically changes the levels of volatility. All non-PSID data series’ volatility levels are now very close to one another, and the LEHD has levels close to that of the others. This reflects the high volatility levels of low earners. But even more importantly, all the data series except the SIPP survey now show more evidence of an upward trend after the late 1990s. Even the LEHD now shows a positive trend instead of a negative one.
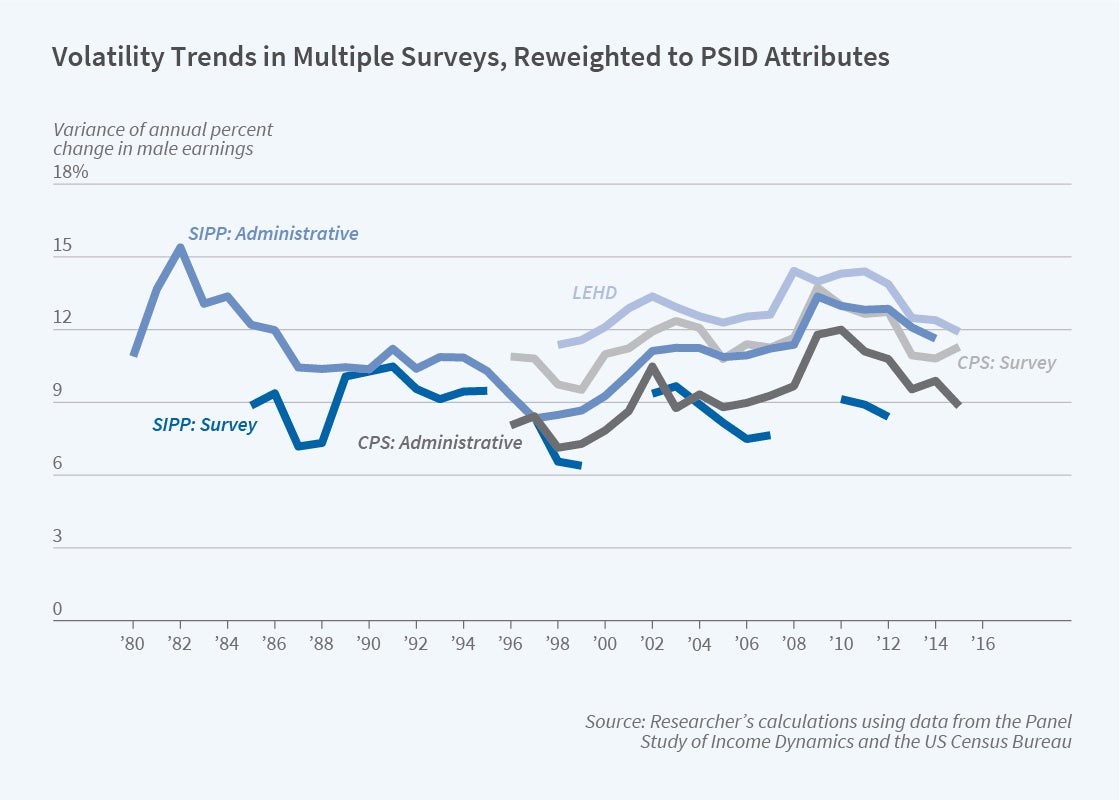
We conclude that earnings volatility for men, while having been flat over the mid-1980s to the mid-1990s after a rise in earlier years, was either flat or even possibly rising after the late 1990s through most of the earnings distribution. But volatility fell for low earners, resulting in either a flat average trend or even a declining one, depending on the dataset.
Moving Forward
Our findings raise many questions for further research. Why, for example, has earnings volatility declined for those with low earnings? Has deindustrialization run its course and low-skill workers settled into relatively stable jobs, possibly with lower average pay but not highly volatile? Has job mobility among low earners — one source of earnings volatility — declined? Have low-skill men with unstable jobs simply dropped out of the labor force altogether and no longer have earnings at all?
Moving beyond the focus of my colleagues’ and my work on male earnings volatility, what have been the trends for women? And what have been the trends for family earnings of married men and women combined, given the well-known interactions between their labor supply decisions?8 These and other questions will be pursued in the search for more insight on earnings volatility.
Endnotes
McConnell M, Perez-Quiros G. “Output Fluctuations in the United States: What Has Changed Since the Early 1980s?” American Economic Review 90(5), December 2000, pp. 1464–1476.
Gottschalk P, Moffitt R. “The Growth of Earnings Instability in the US Labor Market,” Brookings Papers on Economic Activity 2, 1994, pp. 217–254.
Moffitt R, Zhang S. “Income Volatility and the PSID: Past Research and New Results,” NBER Working Paper 24390, March 2018, and AEA Papers and Proceedings 108, May 2018, pp. 277–280.
See my paper with Zhang for a review through 2017 on which administrative studies have shown a decline. For a more recent study, see Bloom N, Guvenen F, Pistaferri L, Salgado S, Sabelhaus J, Song J. “The Great Micro Moderation,” Federal Reserve Bank of Minneapolis Working Paper, 2017.
The LEHD began earlier, but only by 1998 did it have a sufficient number of states to make it accurate for the nation as a whole.
Moffitt R, Zhang S. “Estimating Trends in Male Earnings Volatility with the Panel Study of Income Dynamics,” NBER Working Paper 27674, August 2020; Moffitt R. “Reconciling Trends in US Male Earnings Volatility: Results from a Four Data Set Project,” NBER Working Paper 27664, August 2020; McKinney K, Abowd J. “Male Earnings Volatility in LEHD before, during, and after the Great Recession,” Cornell University Working Paper, 2020; Carr M, Moffitt R, Wiemers E. “Reconciling Trends in Volatility: Evidence from the SIPP Survey and Administrative Data,” NBER Working Paper 27672, August 2020; Ziliak J, Hokayem C, Bollinger C. “Trends in Earnings Volatility Using Linked Administrative and Survey Data,” US Census Bureau, 2020. The papers are currently being revised for a special issue of a journal. The results below are from the latest updates.
Kornfeld R, Bloom H. “Measuring Program Impacts on Earnings and Employment: Do Unemployment Insurance Wage Reports from Employers Agree with Surveys of Individuals?” Journal of Labor Economics 17(1), January 1999, pp. 168–197; Juhn C, McCue, K. “Comparing Measures of Earnings Instability Based on Survey and Administrative Reports,” US Census Bureau Center for Economic Studies, Working Paper 10-15, 2010; Celik S, Juhn C, McCue K, Thompson J. “Recent Trends in Earnings Volatility: Evidence from Survey and Administrative Data,” The B.E. Journal of Economic Analysis & Policy 12(2), 2012; Abraham K, Haltiwanger J, Sandusky K, Spletzer J. “Exploring Differences in Employment between Household and Establishment Data,” Journal of Labor Economics 31(S1), April 2013, pp. 129–172; “Inequality Statistics from the LEHD,” US Census Bureau Center for Economic Studies, Working Paper, 2014; Abowd J, McKinney K, Zhao N. “Earnings Inequality and Mobility Trends in the United States: Nationally Representative Estimates from Longitudinally Linked Employer-Employee Data,” Journal of Labor Economics 36(S1), January 2018, pp. S183–S300; Carr M, Wiemers E. “The Role of Low Earnings in Differing Trends in Earnings Volatility,” Economics Letters 199(C), February 2021.
Dynan K, Elmendorf D, Sichel D. “The Evolution of Household Income Volatility,” The B.E. Journal of Economic Analysis & Policy 12(2), 2012; Ziliak J, Hokayem C, Bollinger C. “Trends in Earnings Volatility Using Linked Administrative and Survey Data,” US Census Bureau Center for Economic Studies, Working Paper CES 20-24, August 2020. Ziliak found declining mobility for women.


