Quantitative Approaches to Violence, Small Wars, and Insurgencies
The surge in quantitative analysis of insurgency, civil wars, and terrorism can be traced primarily to two main drivers. The first is the availability of detailed data that provide fine-grained, micro-level information on violent incidents and on attacks in several theaters of war. The second is the emergence of a set of econometric and statistical approaches appropriate to the analysis of such data.
Concerning the data, new databases differ in structure and origin. Some are created from primary data (live records) from military troops on the ground in Afghanistan, Iraq, Syria, and other areas of active engagement of US military personnel or allied forces with access to geopositioning technology. These include the Significant Activities (SIGACTS) databases for Iraq and Afghanistan declassified by the United States Central Command in recent years (in 2014 for the Afghan data, for example). The SIGACTS Afghan data cover more than 600,000 reports of violent incidents, such as direct attacks, indirect attacks, and improvised explosive device (IED) attacks, each with location, time, and a brief description of the incident, and military activities, such as arms caches discovered. The data, over the period from January 2008 through December 2014, are readily available online. The data for Iraq cover more than 250,000 significant activities from January 2004 through July 2007.
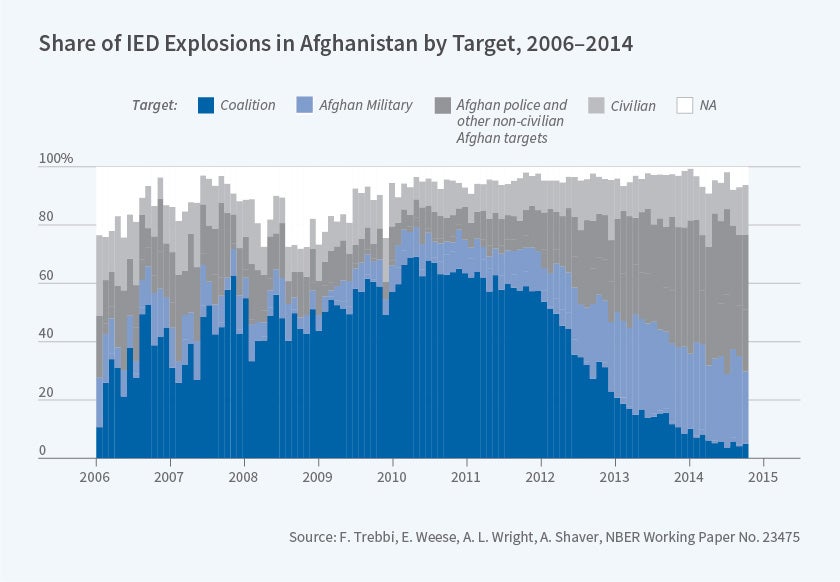
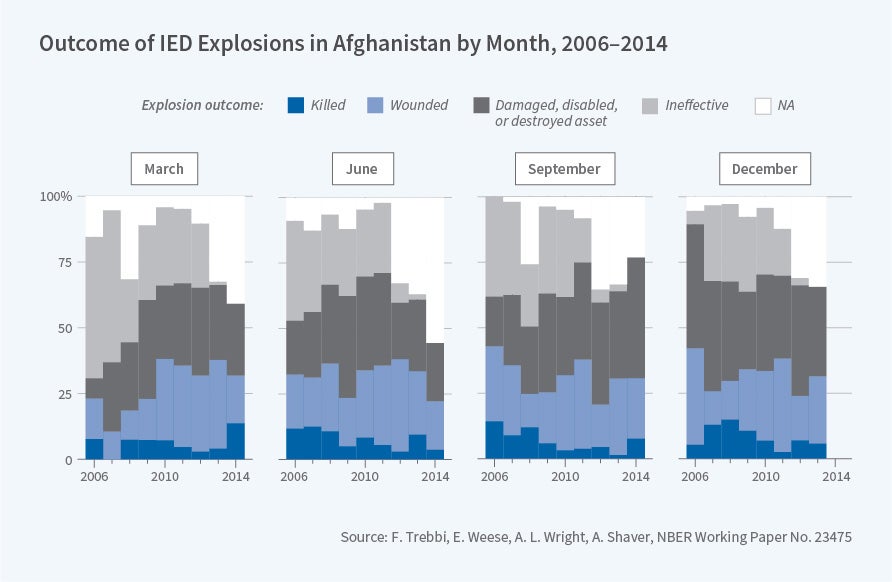
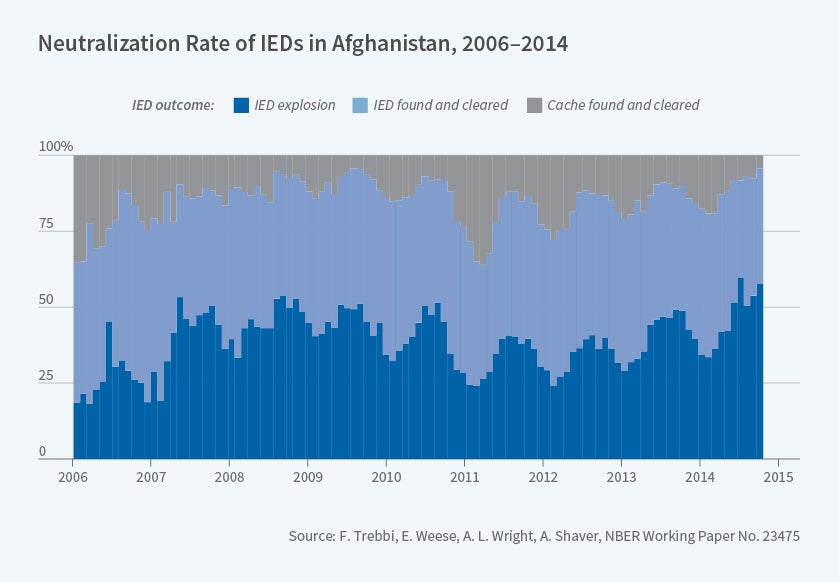
Some of these data prove instructive in tracing surprising dynamics in these costly conflicts. Eric Weese, Austin L. Wright, Andrew Shaver, and I use the Afghan SIGACTS to document that the effectiveness of IED attacks, the most deadly and incisive insurgent tactic employed by the Taliban, remained constant from 2006 through 2014.1 The likelihood of IEDs generating property or human damage is stable at around 23 percent, even as IED use is stable, and its cost goes down over the nine-year period we study. Figures 1a, 1b, and 1c demonstrate this finding by showing relatively constant counts of wounded and killed coalition forces personnel and the stable deployment of IED attacks on the part of the insurgents.
The evidence suggests that in this asymmetric conflict, a US military counterinsurgency investment ranging in the billions of dollars yearly, directed at anti-IED activities alone, according to an official Joint IED Defeat Organization (JIEDDO) 2010 report, was effectively countered by insurgent technological adaptation and investments of tens of millions of dollars.2 The data further allow conflict researchers focused on insurgency to recover parameters approximating the relative effectiveness of offensive versus defensive activities, to express the defense/offense asymmetry in clear quantitative terms, and to assess the speed of learning of Afghan insurgents during the fighting season by looking at the systematically changing nature of the targets of attacks and their effectiveness. In synthesis, from SIGACTS a researcher is able to recover a much clearer picture of the technology of insurgency and its capacity for adaptation.
Other new datasets have a more indirect origin and are sourced from news media and other forms of intelligence reports. Some of these data have a clear link to the area spanning conflict studies and counterterrorism analysis. An example is the Worldwide Incidents Tracking System (WITS). According to John Wigle, WITS is "the US Government's authoritative database on acts of terrorism, and is used to enumerate statistical data for the annual "Country Reports on Terrorism" from the US Department of State and the National Counterterrorism Center's Report on Terrorism.3 Other examples of such databases originate from within academia, as, for example, the BFRS database (the acronym is made from initials of some of its developers) covering violence and insurgency within Pakistan.4
Less fine-grained and direct than SIGACTS, the WITS and BFRS data are extremely useful for capturing highly visible insurgent activities designed to hijack the media cycle, to maximize public exposure of insurgent groups, and to signal strength to the noncombatant population for recruiting or co-opting purposes. A specific instance of this is the overrepresentation within BFRS and WITS of simultaneous attacks carried out within the same day by insurgent groups across different geographic areas.5 Weese and I show how to exploit the covariance structure of attacks over time and across different geographic areas to recover the internal organizational structure of insurgent groups in Afghanistan and Pakistan.6 This "structure" refers to the internal divisions of insurgents across independent groups operating within an umbrella coalition. An open question about the Afghan Taliban was whether it was a unitary organization or a heterogeneous coalition.
To illustrate how the WITS data can be useful, consider observing violent incidents over time and at daily frequency in two geographic districts, A and B. Having a violent incident in both on the same day may well be the result of random occurrence in an environment plagued by unorganized violence, not necessarily a simultaneous attack signaling the presence of the same group in the two areas. However, if systematically when an attack occurs in A, another occurs in B on the same day, then it is more likely that one organization is coordinating attacks in both locations.
Next, consider violent incidents over time and at daily frequency in two other districts, C and D. If a positive and statistically significant correlation between C and D is also observed, but no correlation between C and A or C and B is observed, then two clusters of attack correlations start to emerge: A–B and C–D as opposed to A–B–C–D. Our research applies classification and unsupervised clustering algorithms to the estimated variance covariance matrix of attacks across districts within Afghanistan or Pakistan, and thereby obtains new information about the insurgency.7 The clustering methods formally reject the hypothesis of a fragmented organization of the Afghan Taliban in favor of a highly organized and unitary entity during the period of analysis. In contrast, in Pakistan, violence appears to be the outcome of actions by multiple groups. We use incident-level data to estimate the ethnic-based structure of the various insurgencies in Pakistan and even to detect when new insurgent groups enter the conflict.
Approaches to conflict analysis that utilize microdata can apply methods from unsupervised machine learning to study questions of violence and insurgency. Problems of estimating the number of combatant groups, the unknown number and strength of latent alliances, and other classification problems central to conflict studies require different tools from standard regression analysis. We show how econometric tests typically used in the context of time series econometrics can be used to test for the number of latent insurgent groups/clusters in conflict.8 We conclude that the structure of the Taliban is one group because a large fraction of the latent variation of the covariation in attacks is explained by a single cluster.
Advances in the design of surveys and survey experiments have also been delivering important insights on human behavior in conflict environments. For example, Leonardo Bursztyn, Michael Callen, Bruno Ferman, Saad Gulzar, Ali Hasanain, and Noam Yuchtman isolate anti-US intrinsic motivation of men in Pakistan after controlling for a number of potentially confounding factors.9 Advances in the economics and econometrics of networks are also finding application in conflict studies. For example, Michael König, Dominic Rohner, Mathias Thoenig, and Fabrizio Zilibotti show how the detailed conflict level information from the Armed Conflict Location & Event Data Project (ACLED) could be used to reconstruct the complex matrixes of enmities and alliances among insurgent groups in the Democratic Republic of the Congo between 1998 and 2010.10
To conclude, one can easily see how methodological and data advancements in the areas considered in this short review may be extended to other fields of research or conflict zones.11 As conflict studies evolve, issues of pacification, de-escalation, or post-conflict humanitarian and development intervention will become deeply intertwined with issues of political economy and national security.
Endnotes
"Insurgent Learning," Trebbi F, Weese E, Wright A, Shaver A. NBER Working Paper 23475, June 2017.
Joint Improvised Explosive Device Defeat Organization (JIEDDO), 2010 Annual Report. https://www.hsdl.org/?view&did=682214
"Introducing the Worldwide Incidents Tracking System (WITS)," Wigle J. Perspectives on Terrorism 4(1), 2010, pp. 3–23.
Many of the datasets described in this article can be downloaded at esoc.princeton.edu under the Empirical Studies of Conflict initiative. "Measuring Political Violence in Pakistan: Insights from the BFRS Dataset," Bueno de Mesquita E, Fair C, Jordan J, Rais R, Shapiro J. Conflict Management and Peace Science 32(5), November 2015, pp. 536–558.
Other examples of similarly designed databases of geocoded and time-stamped violent incidents include the Global Terrorism Database at the University of Maryland.
"Insurgency and Small Wars: Estimation of Unobserved Coalition Structures," Trebbi F, Weese E. NBER Working Paper 21202, May 2015, and Econometrica 87(2), March 2019, pp. 463–496.
"Eigenvalue Ratio Test for the Number of Factors," Ahn S, Horenstein A. Econometrica 81(3), May 2013, pp. 1203–1227.
Identifying Ideology: Experimental Evidence on Anti-Americanism in Pakistan," Bursztyn L, Callen M, Ferman B, Gulzar S, Hasanain A, Yuchtman N. NBER Working Paper 20153, May 2014. About 25 percent of the men surveyed were willing to forgo up to 20 percent of their average daily wage rather than express gratitude to the US government by checking a box in a questionnaire.
"Networks in Conflict: Theory and Evidence from the Great War of Africa," König M, Rohner D, Thoenig M, Zilibotti F. Econometrica 85(4), July 2017, pp. 1093–1132.


