The Challenge of Measuring Inflation in Pharmaceutical Prices
Ignoring price rebates negotiated by insurance companies and benefits managers may significantly overstate estimates of drug price inflation.
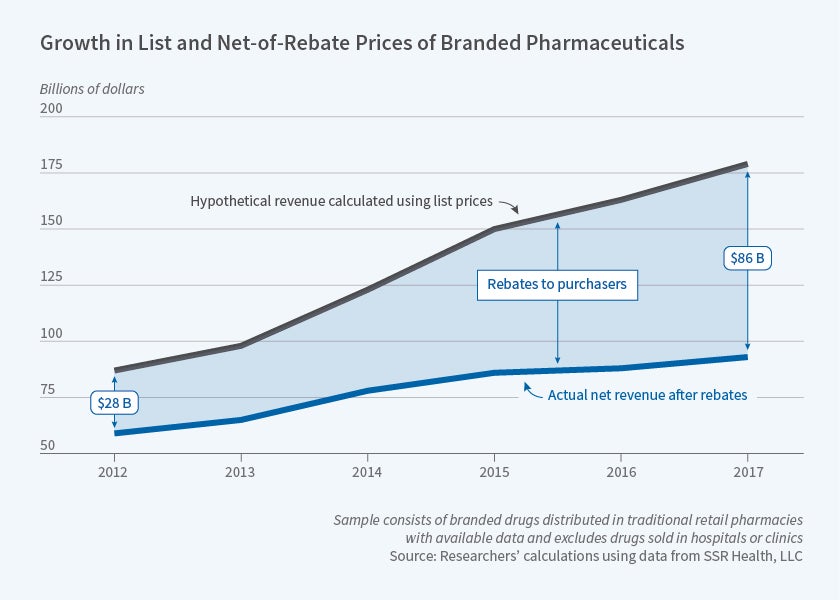
From 2012 to 2017, the average rebate as a share of prescription drug list prices rose from 32 to 48 percent, according to analysis of novel data on drug sales by Pragya Kakani, Michael Chernew, and Amitabh Chandra. In Rebates in the Pharmaceutical Industry: Evidence from Medicines Sold in Retail Pharmacies in the US (NBER Working Paper 26846), they conclude that by focusing on list prices, indices of prescription drug costs may significantly overstate the actual inflation rate.
A rebate is the difference between the list price of a drug and purchase prices negotiated between insurers or pharmaceutical benefit managers and the drug’s maker. A simple example illustrates the potential importance of a drug’s rebate rate. If a drug with a list price of $10 and a rebate rate of 25 percent doubles its list price to $20, while the rebate rate rises to 50 percent, the list price increases by 100 percent, while the net of the rebate price increases by only 33 percent, from $7.50 to $10.
The researchers attribute the growth in rebates almost entirely to rising rebates for the same drugs, rather than shifts in market share to drugs carrying larger rebates. When shifts in market share did occur, they were toward new, more effective drugs that commanded higher net prices. Without such shifts, average annual rebate growth would have been 4.8 percent rather than 3.2 percent.
With access to closely held rebate data, the researchers used a sample of branded drugs sold by retail pharmacies, excluding those dispensed in clinical settings. Net prices were based on average payments across market segments: commercial, Medicare, and Medicaid. They did not have access to specific rebate data.
Aggregating all price data, the researchers estimate that list prices rose by a compound annual rate of 12 percent between 2012 and 2017, while net prices rose by only 3 percent. Drilling down, they analyzed pricing trends for different drug categories. They found important disparities across drug classes. For example, between 2012 and 2017, list prices for insulin rose at an annual rate of 16 percent, while net prices rose by only 2 percent a year. In contrast, for hepatitis C treatments, between 2012 and 2014, net prices rose on average 88 percent per year, while list prices rose 62 percent, as a result of the introduction of the powerful drug Sovaldi. From 2014 to 2017, however, with the entry of additional hepatitis C therapies, the trend reversed and net prices fell while list prices remained stable.
Recognizing the role of rebates also requires revision of conventional wisdom about the share of the growth in pharmaceutical company revenue that is driven by increases in the price of drugs already on the market versus the entry of new products. As measured by list prices, hikes in the cost of existing drugs accounted for 76 percent of revenue growth. However, after accounting for rebates, revenue from existing drugs explained just 31 percent of growth.
Rebates have had an uneven impact on consumers. Assuming robust competition among insurers and pharmaceutical benefits managers, consumers could receive much of the savings in the form of lower premiums and co-pays. However, where competition is imperfect, benefit managers or insurers could retain a greater share of the rebates.
The rise in rebates does not help the uninsured, who have no one to negotiate on their behalf and who may therefore pay list prices, or insured consumers on expensive medication, who may face higher out-of-pocket costs in connection with coinsurance payments that are pegged to list prices rather than to net-of-rebate prices. “Thus, while insured patients with fewer health needs may benefit from lower premiums associated with rebates,” the researchers conclude, “sicker or uninsured patients may be worse off and may forgo valuable drugs.”
— Steve Maas


