Buybacks, Dividends, and Internal Corporate Investment
A greater proportion of American companies are older, larger, and more profitable than in the late 20th century, which explains much of the increase in corporate payouts.
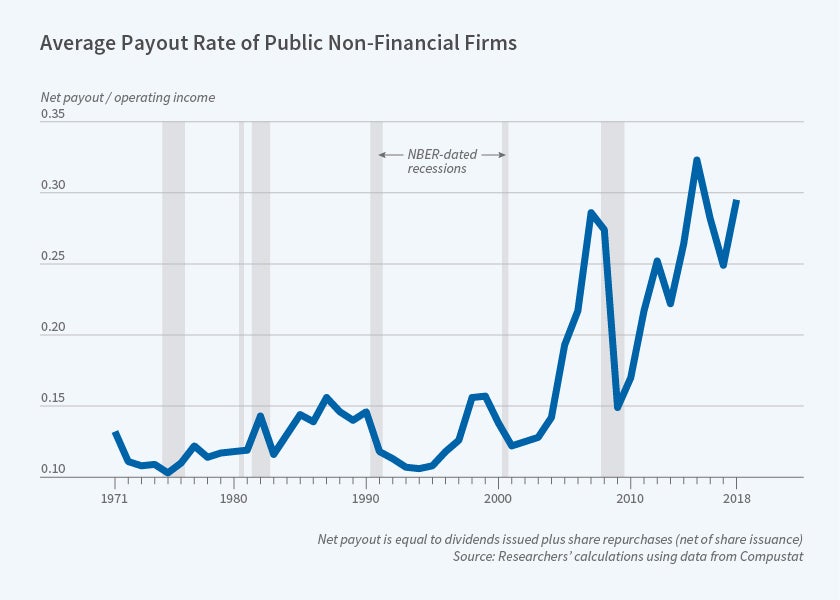
Since 2000, corporations have spent three times as much buying back shares and paying dividends as in the period 1971 to 1999. The trend has sparked concern in some quarters that firms are foregoing internal investments that might boost innovation or make their workers more productive.
Generalizations are difficult, however, and the analysis needs to be firm-specific, according to Kathleen Kahle and René M. Stulz in Are Corporate Payouts Abnormally High in the 2000s? (NBER Working Paper 26958). “Abnormally high payouts can be a good development if funds retained within the firm would otherwise have been wasted, or a bad development if the funds would have been better employed within the firm,” they write.
Among the nonfinancial firms listed on US exchanges that the researchers studied, the rise in payouts comes entirely from share buybacks. Dividends as a share of operating income dipped slightly from 14.4 percent before 2000 to 14 percent in the 2000–17 period. In contrast, share repurchases surged from 4.8 percent of operating income before 2000 to 21.2 percent in the post-2000 period. US corporations spent nearly $10 trillion between 2000 and 2017 buying back their shares.
The researchers identified several factors that have contributed to rising share repurchases. US corporations have had more profits in the aggregate in the 2000s than in the 1971–99 period. That alone explains 38 percent of the increase in payouts. In addition, the composition of corporate America has changed. Today a greater proportion of companies are older, larger, have substantial cash holdings, and are less indebted than in the late 20th century.
To analyze how these changing firm attributes contribute to payouts, the researchers estimated statistical models to explain payout behavior in the 1971–99 period, and then tried to predict payout patterns after 2000. They found that their models could predict fairly accurately post-2000 aggregate results. For example, they predicted payouts of $784 billion for 2017; the actual was $734 billion. When the researchers predicted payouts for individual firms, however, they tended to underestimate the actual values. The gap was particularly noticeable in extreme payout years, such as 2017, when the firm-level models predicted that firms would pay out 26 percent of their operating income, but the actual rate was 48 percent.
The researchers did not find any evidence that higher payouts had reduced corporate capital expenditures or corporate performance. The firms in the top 10 percent of the payout distribution had higher returns than firms in the lower 90 percent, and they had less debt and a lower level of capital expenditures relative to assets. While their capital expenditures fell after 2000, the same was true for firms with lower payouts.
—Laurent Belsie


