Test-Optional Policies and Disadvantaged Students
The role of standardized tests in college admissions has been a subject of intense discussion and evolving policies for some time. While proponents argue that test scores are vital indicators of academic preparedness, others believe they perpetuate inequality because of differential access to test preparation and the potential for cultural bias in test content. This debate led some colleges and universities to adopt test-optional policies. Then, during the COVID-19 pandemic, the vast majority of American colleges and universities stopped requiring standardized test scores, as the tests stopped being administered in much of the country. Many schools are currently reevaluating whether and how they should use standardized tests as part of admissions moving forward.
In How Test-Optional Policies in College Admissions Disproportionately Harm High-Achieving Applicants from Disadvantaged Backgrounds (NBER Working Paper 33389), Bruce Sacerdote, Douglas O. Staiger, and Michele Tine examine the impact of test-optional policies at Dartmouth College. The researchers show that test-optional policies are detrimental to high-achieving, disadvantaged students because under such policies high-achieving, disadvantaged students submit scores at too low a rate, thereby lowering their chances of admission.
Disadvantaged students with SAT scores above 1400 can substantially boost their probability of college admission by submitting their scores.
The researchers study two test-required admissions years (2017 and 2018) and two test-optional years (2021 and 2022). During the test-optional years, some students submitted their test scores when taking the exam but later requested that the scores not be used in admissions. The researchers were able to see the “hidden scores,” which allowed them to compare the probability of admission for students who had the same SAT score but where one student revealed that score to admissions and the other did not.
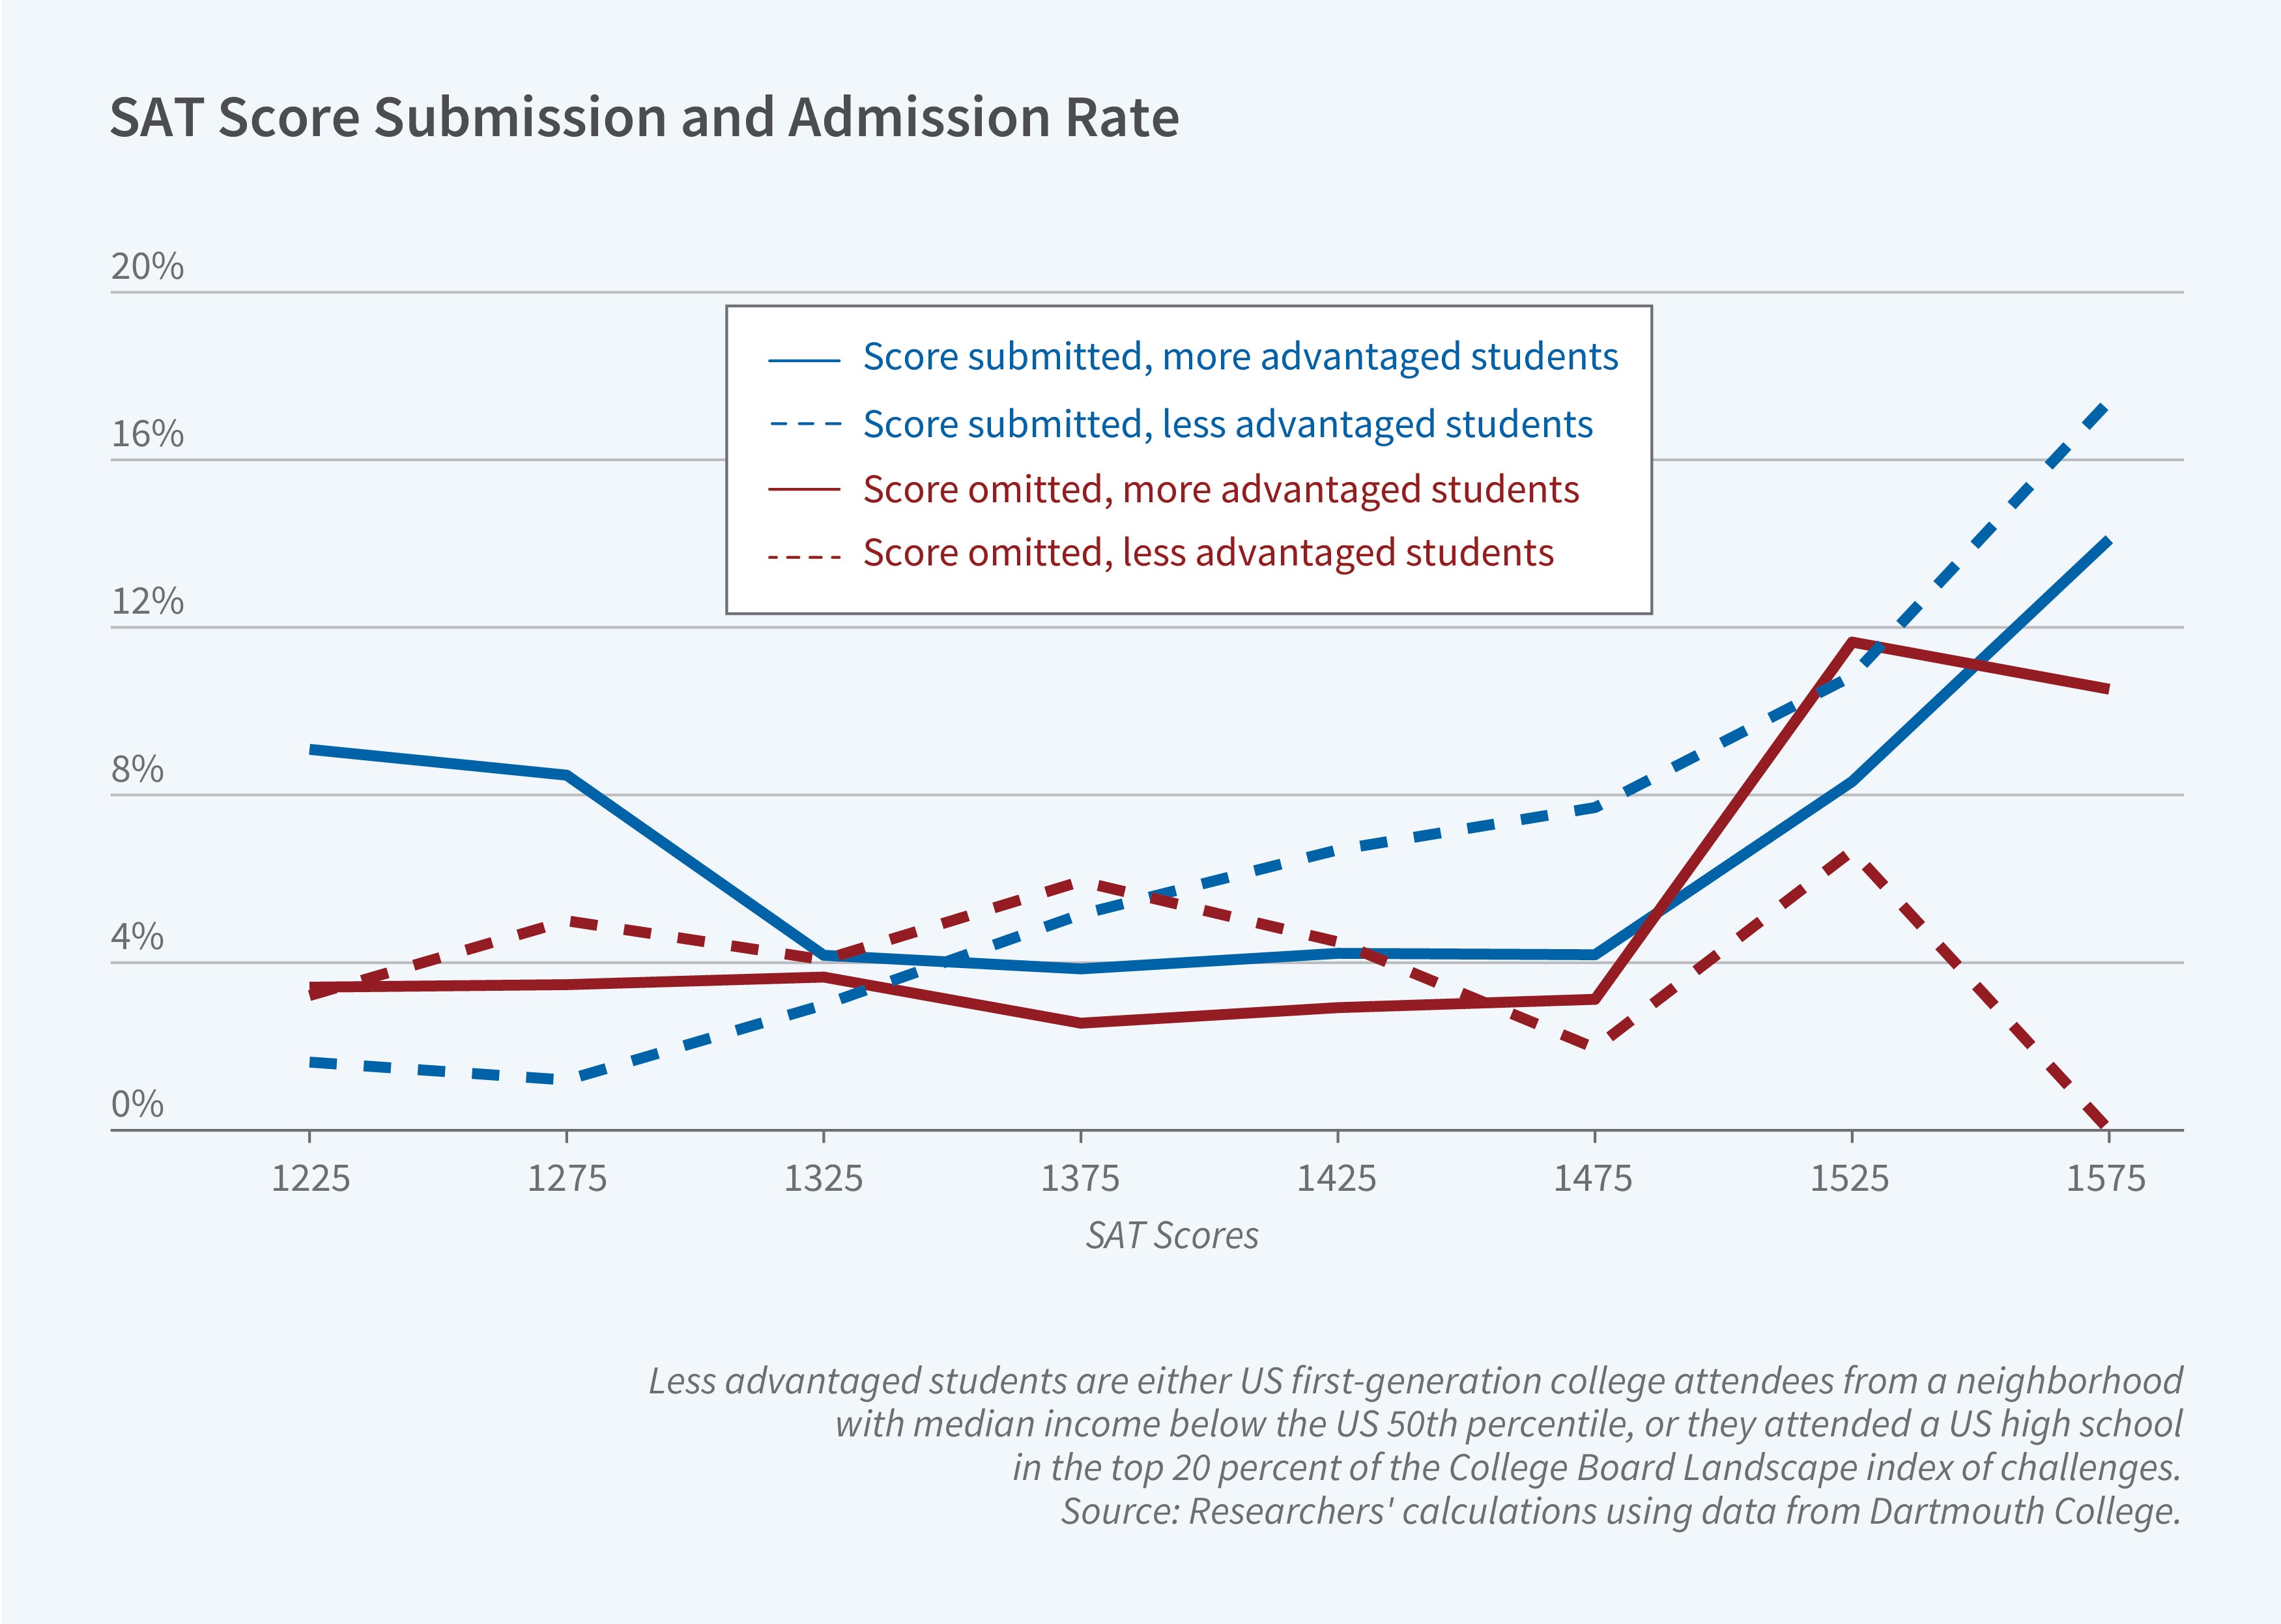
They find that test-optional policies reduce the probability of admission for high-achieving, disadvantaged students. Specifically, the authors find that disadvantaged students with an SAT score above 1400 (out of a possible 1600) were more than three times as likely to receive an admissions offer if they submitted their score than if they did not. A disadvantaged student with a score of 1550 increases their chance of admission by 10 percentage points by submitting their score. Despite this benefit, not all disadvantaged students with high scores choose to submit them. The increase in admission probability associated with submitting a high score is much smaller for students from more advantaged backgrounds. This suggests admissions officers can more readily interpret their applications due to familiarity with their high schools’ reputations and academic standards.
Importantly, admissions officers consider applicants within the context of their neighborhood and school, meaning a student from a disadvantaged background with a high SAT score will receive greater attention for their score than a student from an environment where high scores are common. For example, a high score is a more positive signal for a student from a high school where 1200 is the 75th percentile score than for a student attending a school where the 75th percentile score is 1400.
The researchers note that the way in which scores are used in context is not always clear to applicants. Students from disadvantaged backgrounds are unlikely to realize that their score may have a higher potential impact on their likelihood of admission than on that of a more advantaged applicant with the same score.
The researchers also show that the switch to a test-score-optional policy did not increase the demographic diversity of the applicant pool and that test scores predict academic success in a similar way regardless of student background. In contrast, other aspects of the application, like guidance counselor recommendations, are less predictive of academic success in college and tend to favor higher-income students.
— Greta Gaffin


