A Global Perspective on Industrial Policy and the Semiconductor Industry
In 2022, Congress passed and President Biden signed the Creating Helpful Incentives to Produce Semiconductors (CHIPS) Act, which included tens of billions of dollars in grants and loans for production facilities and research, as well as new investment tax credits for domestic semiconductor manufacturing plants. The recent rise of similar subsidies in other nations has raised concerns about an international subsidy race and questions about the economic rationale for such policies.
In Industrial Policy in the Global Semiconductor Sector (NBER Working Paper 32651), researchers Pinelopi K. Goldberg, Réka Juhász, Nathan J. Lane, Giulia Lo Forte, and Jeff Thurk examine the history of government support for the semiconductor industry in many nations and present new evidence on the extent to which learning-by-doing, a traditional economic rationale for subsidizing an industry’s growth, may justify such subsidies.
The average semiconductor-producing country has provided substantial subsidies to support its domestic industry.
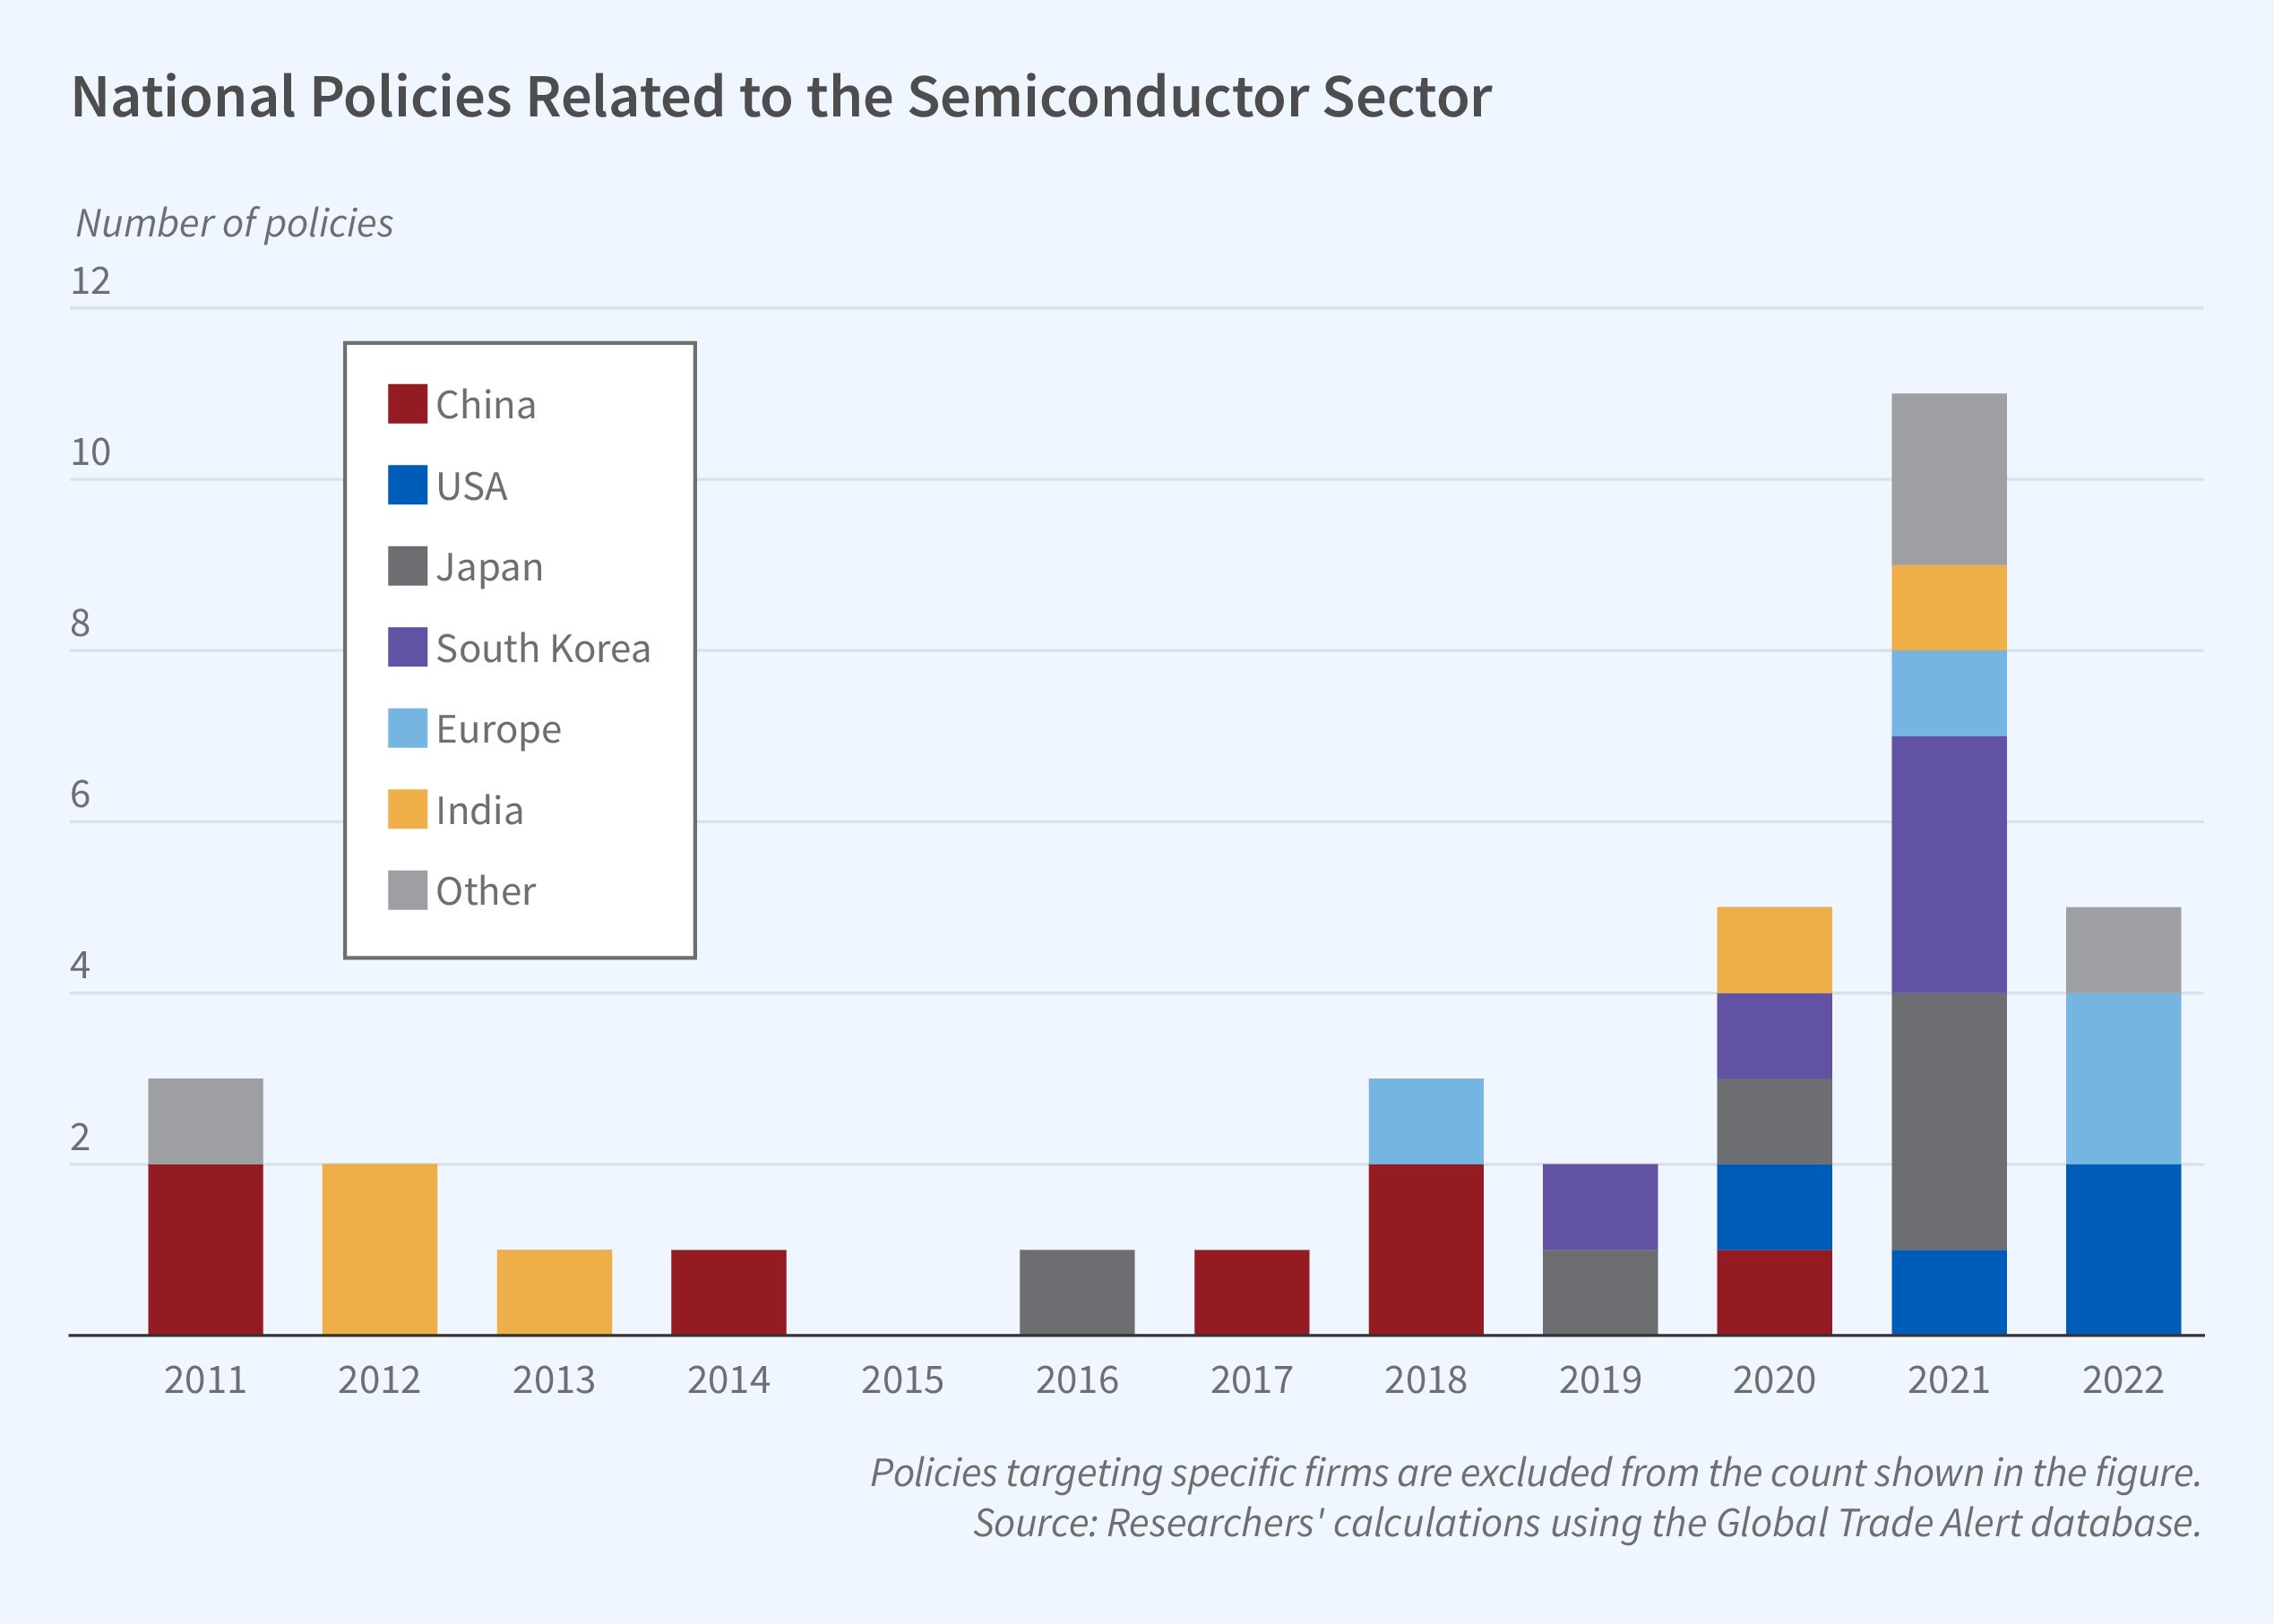
The researchers search the industrial policy dataset of Juhász, Lane, Oehlsen, and Pérez (2022), which is based on the Global Trade Alert database, to identify state financial incentives and other financial policies between 2010 and 2022. They highlight several data challenges, most importantly that in China, subnational governments — which are not included in this database — are a key source of industrial subsidies. After augmenting these data with other information, the researchers conclude that most of the 17 countries that are actively involved in the production of semiconductors have provided support to this sector. Between 2010 and 2022, the average jurisdiction adopted four policies and spent about $12.8 billion (including policies targeting specific firms). These policies are concentrated among five established producers — China, Europe, Japan, South Korea, and the US — and one new entrant, India. Taiwan does not appear to have offered industrial subsidies during the period covered by the Global Trade Alert database, though it may have done so earlier. Government support has historically been greatest when the industry is getting started in a country.
Learning-by-doing, by reducing future production variable costs through higher levels of current production, can justify startup subsidies to currently uncompetitive firms because it may make them competitive in the future and because there may be positive spillovers to the rest of the economy. While a valid conceptual point, its relevance for policy depends critically on the speed, magnitude, and nature of such learning, e.g., is it internal to the chips-producing firm or is it shared with other producers? The researchers estimate the rate of learning using data on semiconductor prices provided by the Global Semiconductor Alliance for the period 2004–2015. They focus on microprocessors, “systems on a chip,” and commodity integrated circuits, and estimate a learning rate of 3.4 percent at the firm-technology node level. This is much lower than “industry lore.” Allowing for within-firm spillovers across technology nodes yields a somewhat higher learning rate, about 4.7 percent per year. However, the researchers also estimate substantial cross-country learning effects, which they hypothesize are due to customers transmitting new advances from one producer to another. While within-product and cross-product within-firm learning accrues to the firm producing the chips and the nation providing the subsidies, cross-border learning does not.
—Laurel Britt
Researchers gratefully acknowledge funding from the Alfred P. Sloan Foundation.


