The Value of Improving Hurricane Forecasts
Hurricane forecasts are critical to government agencies that plan both pre- and post-landfall storm responses. More accurate forecasts enable these agencies to devote resources to the locations where they will matter most. In The Social Value of Hurricane Forecasts (NBER Working Paper 32548), Renato Molina and Ivan Rudik estimate how improvements in weather forecast accuracy between 2007 and 2020 affected the average cost of pre-landfall protective spending and post-landfall damages and recovery spending.
The researchers draw on data and prediction models from the US National Hurricane Center, analyzing both predicted and actual county-level wind speeds and precipitation levels for storms in the US between 2005 and 2020. They focus on storms that either registered as Category 3 or higher, or caused at least $20 billion in damage. Out of 29 hurricanes during this period, 18 met these criteria, accounting for more than 90 percent of the hurricane-caused deaths and property damage during this 16-year period. The researchers also analyze county-level pre-hurricane preparation expenditures from FEMA’s Public Assistance Grant Program, and county-level hurricane damages from the Spatial Hazard Events and Losses Database for the United States.
The greater accuracy of hurricane forecasts in 2020 relative to 2007 saved about $5 billion, on average, in emergency funds and damages.
The paper shows that federal emergency funding allocations are tied to wind speed predictions. A county that is predicted to experience hurricane-force winds receives $30 million more in such spending, on average, than one that is predicted to experience sub-hurricane-force winds. In addition, when forecasts underestimate actual wind speeds, damages are greater. For example, when forecasts call for a Category 1 storm but a Category 3 ultimately strikes a county, storm damages rise by roughly $500 million and post-storm federal spending rises by about $30 million.
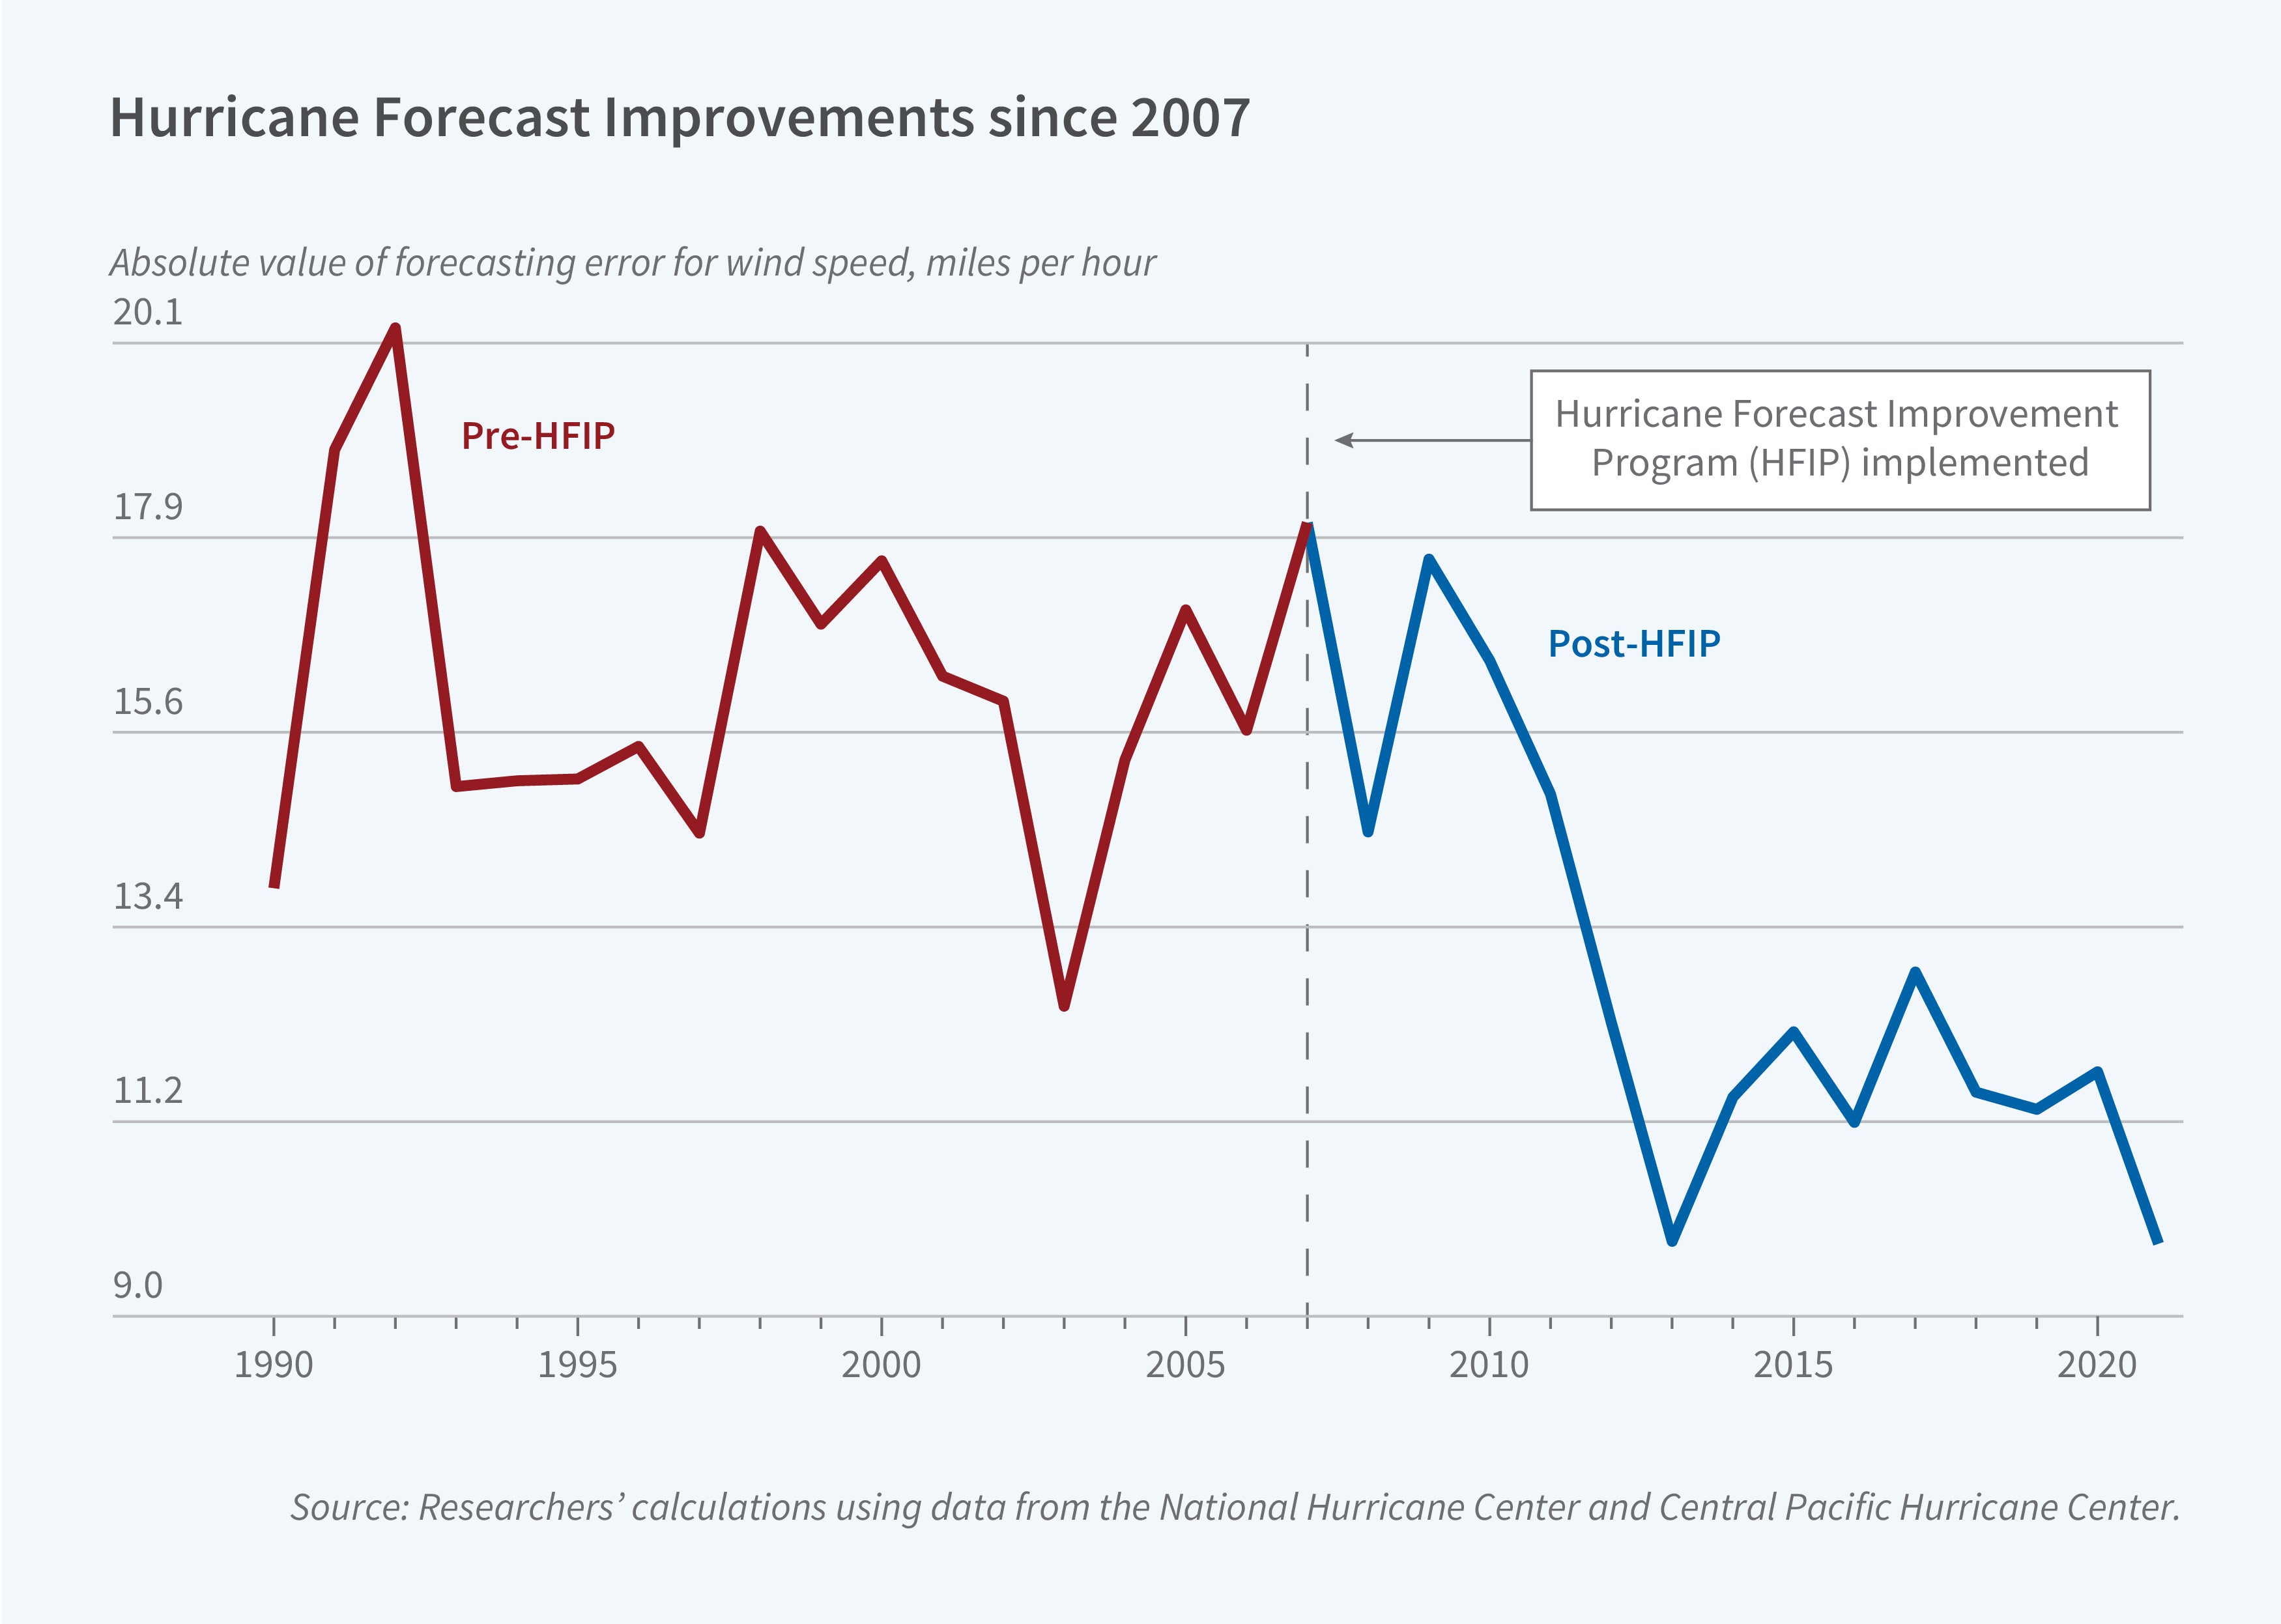
The researchers estimate that for each 1 standard deviation improvement in the accuracy of wind-speed forecasting, there is a $30 million reduction in county-level spending per hurricane. This is driven entirely by spending reductions in counties that experienced hurricane-force winds. They also estimate that forecasting errors related to wind speed have fallen each year between 2007 and 2020 by about 0.21 meters per second, or about 3 percent. This translates into a reduction of nearly 50 percent in error rates over this period. These improvements imply an annual per-hurricane cost reduction of $700,000 per county, or $5 billion per hurricane — a reduction of 19 percent. The per-storm reduction in losses associated with these post-2007 forecasting improvements far exceeds total annual government spending on weather forecasting each year.
—Emma Salomon
Funding for this project was provided by Grant NA20OAR4320472 from the National Oceanic and Atmospheric Administration.


