Effects of Texas' Top Ten Percent College Admissions Plan
While some colleges use transparent criteria such as grade point averages (GPAs) and class ranks to evaluate applicants, many add elements such as applicant essays and letters of recommendation to their admissions process. Broader criteria allow colleges to consider more information about applicants at the cost of increased opacity of the admissions process. This lack of transparency may deter applicants who are uncertain about their chances of satisfying vague requirements.
In Transparency and Percent Plans (NBER Working Paper 32372), Adam Kapor studies the Texas Top Ten Percent Plan, a policy dating back to 1997 that guarantees admission to any Texas public college to high school students whose grades are in the top 10 percent of their class. Kapor studies the effect of the policy on application, admission, and matriculation decisions.
Guaranteeing admission to a flagship state university to the top 10 percent of high school graduates raised enrollment of economically disadvantaged students but had few other effects on diversity.
By comparing students just above and just below the 90th percentile in their high school class, Kapor finds that being in the top 10 percent raises the probability that a student will attend a flagship state university, identified as UT Austin and Texas A&M, by 13.8 percentage points. This is due in part to an increase in submitted applications: students just above the cutoff are 17.7 percentage points more likely to apply to a flagship school.
To disentangle the “mechanical” component of increased attendance due to the increased probability of admission from the “informative” component of transparent signals of students’ acceptance probability, Kapor exploits variation in students’ probability of admission to a flagship school absent the plan. He finds that 69 percent of the increase in affected students’ flagship school enrollment is attributable to information. This finding suggests that opaque admissions processes can deter students, even those with relatively high probabilities of admission, from applying.
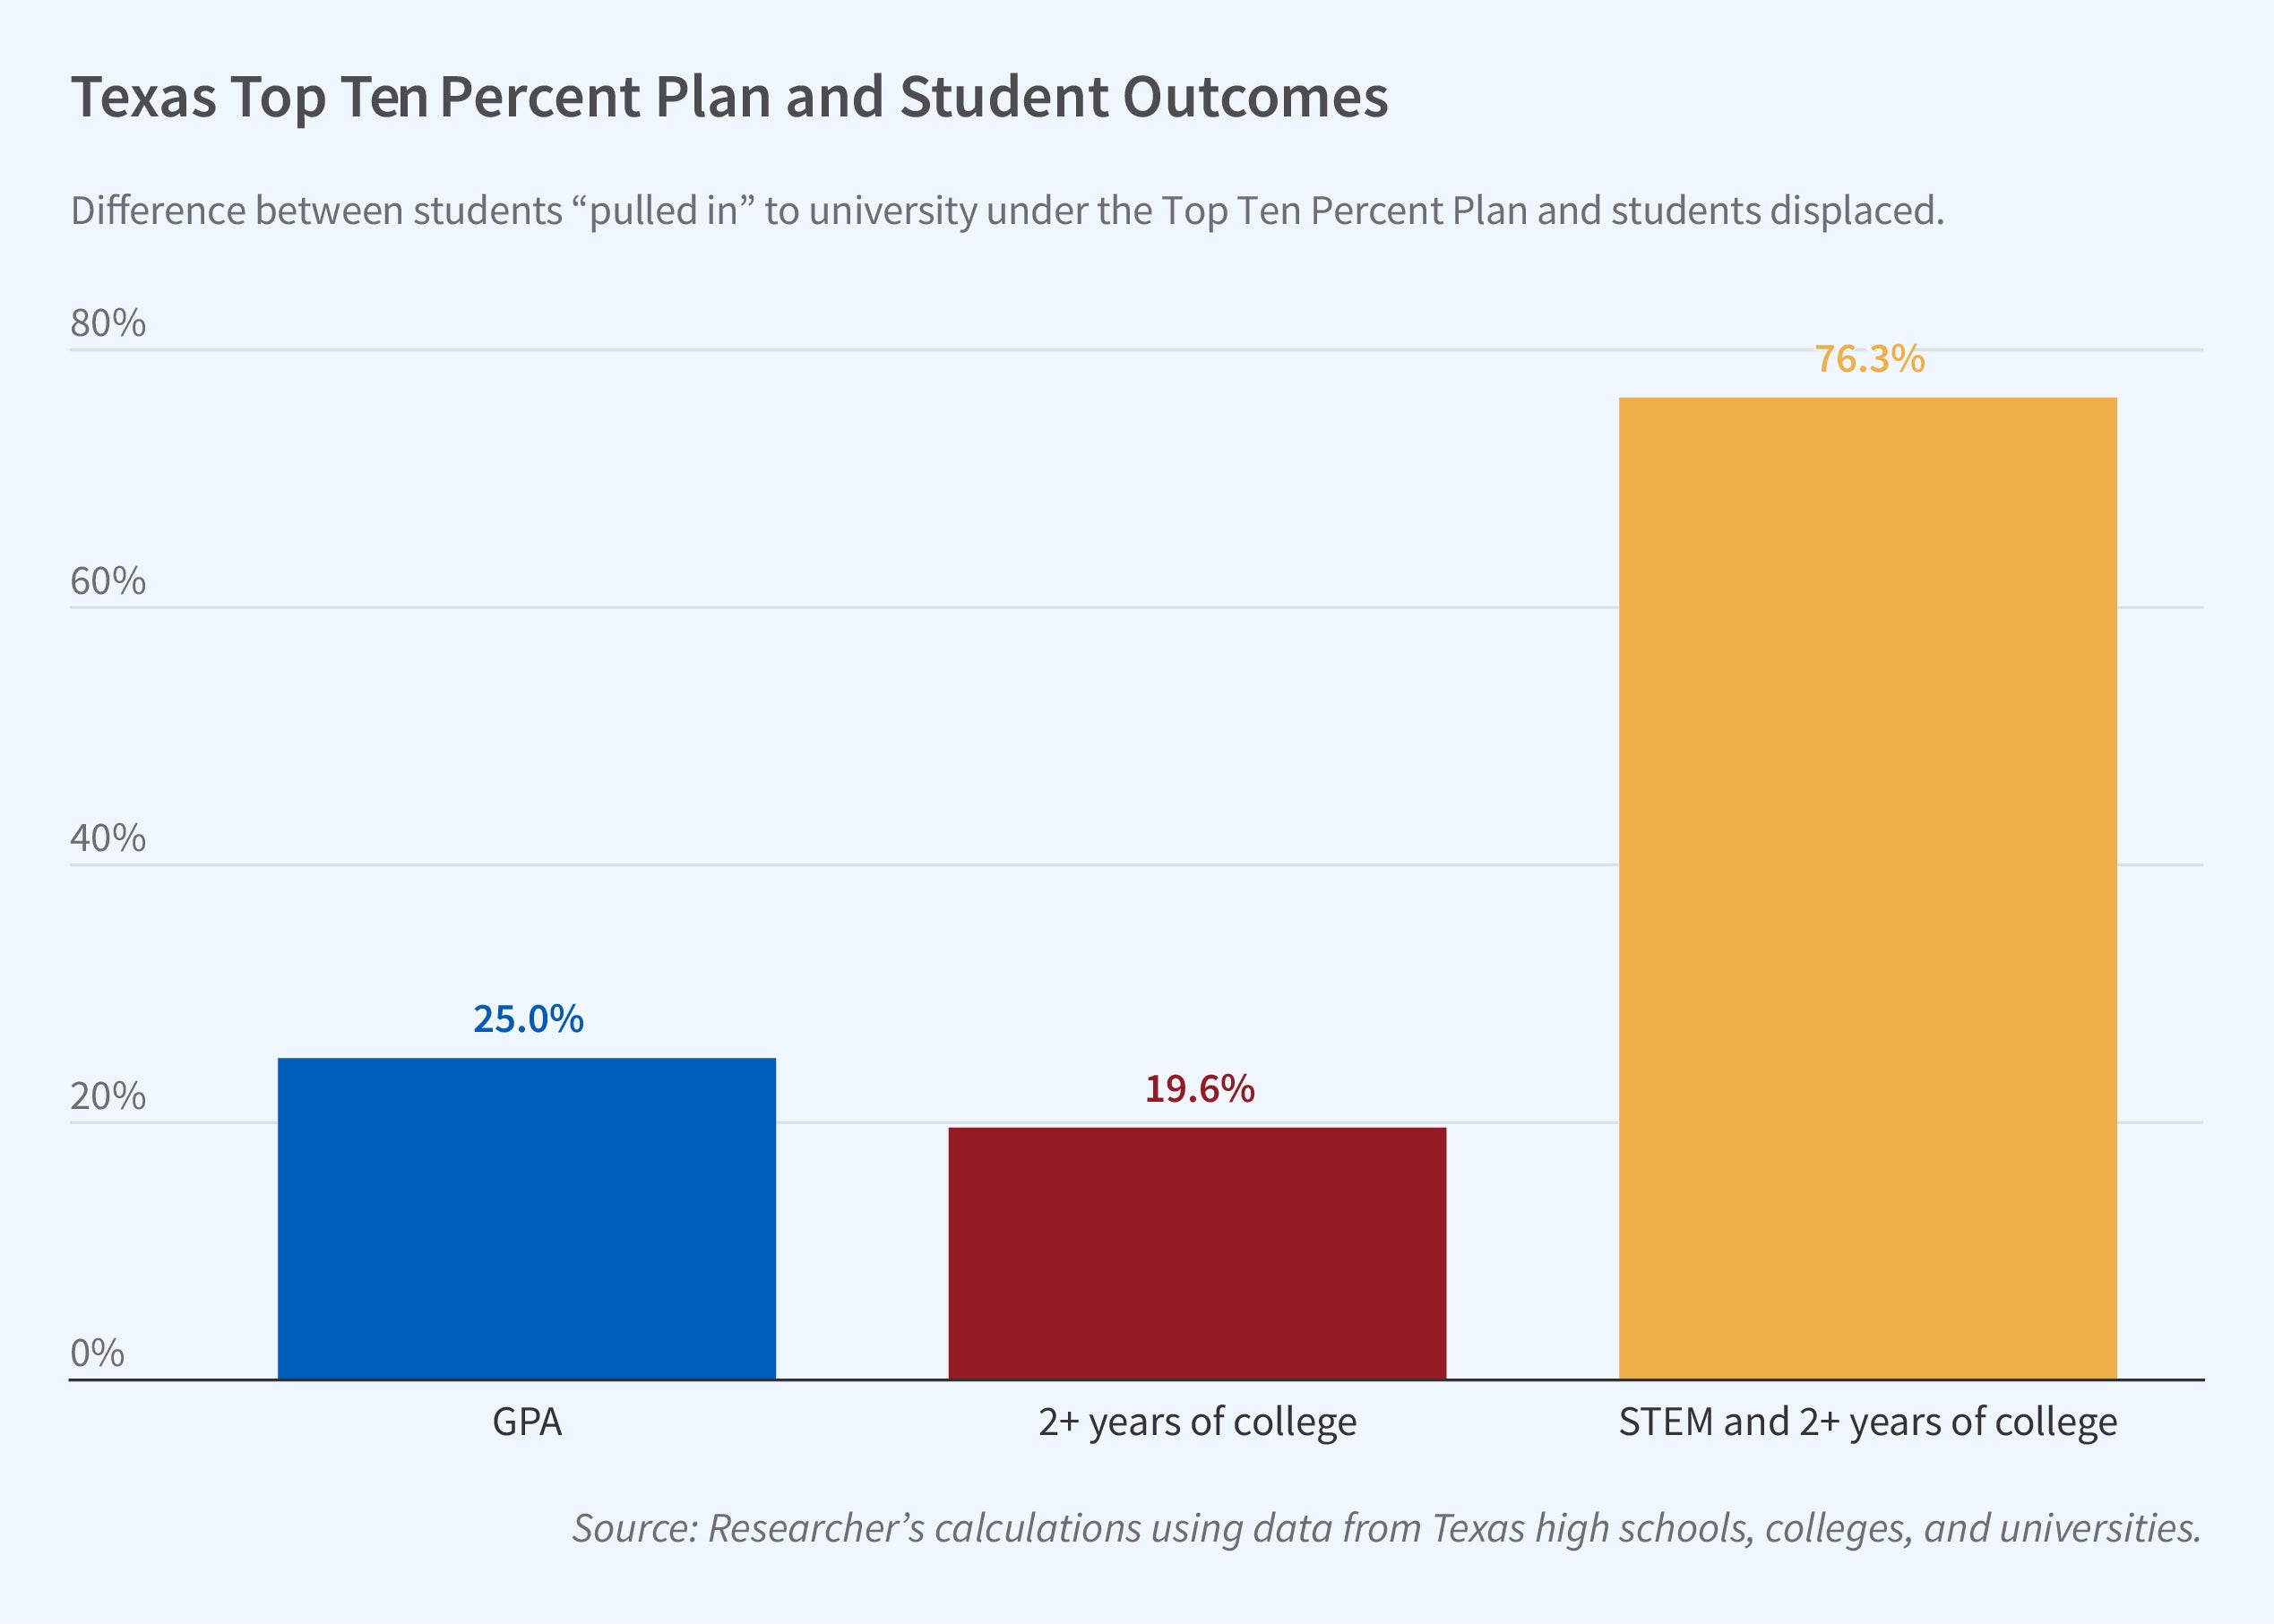
The additional top 10 percent students who enroll in flagship schools displace other students who otherwise would have attended those flagship schools. Kapor finds that the “pulled-in” students have higher academic achievement than the displaced students: they have a 0.71 higher average GPA, are 16 percentage points more likely to remain in college for at least two years, and are more likely to choose STEM majors. They are also more likely to come from high schools with a high percentage of economically disadvantaged students, but they are only slightly more likely to be members of racial minorities than the students they displace. This is in part because the Top Ten Percent Plan raises the admissions standards at flagship schools for students who are not admitted under it; this has the effect of pushing out some underrepresented minority students.
Overall, the findings suggest that simple and transparent admissions policies can induce some academically gifted students — especially those from economically disadvantaged backgrounds — to apply and increase the share of such students who matriculate.
—Shakked Noy
The researcher gratefully acknowledges financial support from the Cowles Foundation for Research in Economics, the Jack Kent Cooke Foundation, and a Yale University Dissertation Fellowship. The data requires the following acknowledgment: This research uses data from THEOP, a project directed by Marta Tienda, at Princeton University, in collaboration with Teresa A. Sullivan, formerly at the University of Texas at Austin. This research [THEOP] was supported by grants from the Ford, Mellon and Hewlett Foundations and NSF (Grant SES-0350990). THEOP gratefully acknowledges institutional support from Princeton University’s Office of Population Research (NICHD Grant R24 H0047879).


