Reduced Medicaid Access, Increased Crime
In 1993, Tennessee launched TennCare, a program that expanded traditional Medicaid coverage to include low-income adults who were childless and not disabled or elderly. The program offered low-cost preventative and diagnostic services, prescriptions, and, importantly, behavioral and alcohol and drug use rehabilitation services. By late 2004, TennCare covered a quarter of the state’s residents, and its adult Medicaid participation rate was the highest in the nation. The program consumed 30 percent of the state budget, and it was deemed unsustainable and discontinued in 2005. Over the remainder of that year, 10 percent of the state’s Medicaid enrollees — 3 percent of the state’s population — were cut from the rolls.
In Losing Medicaid and Crime (NBER Working Paper 32227), Monica Deza, Thanh Lu, Johanna Catherine Maclean, and Alberto Ortega study the consequences of this policy change for criminal activity. They note that most of the 190,000 individuals who were disenrolled from Medicaid were in the demographic category most prone to criminal activity.
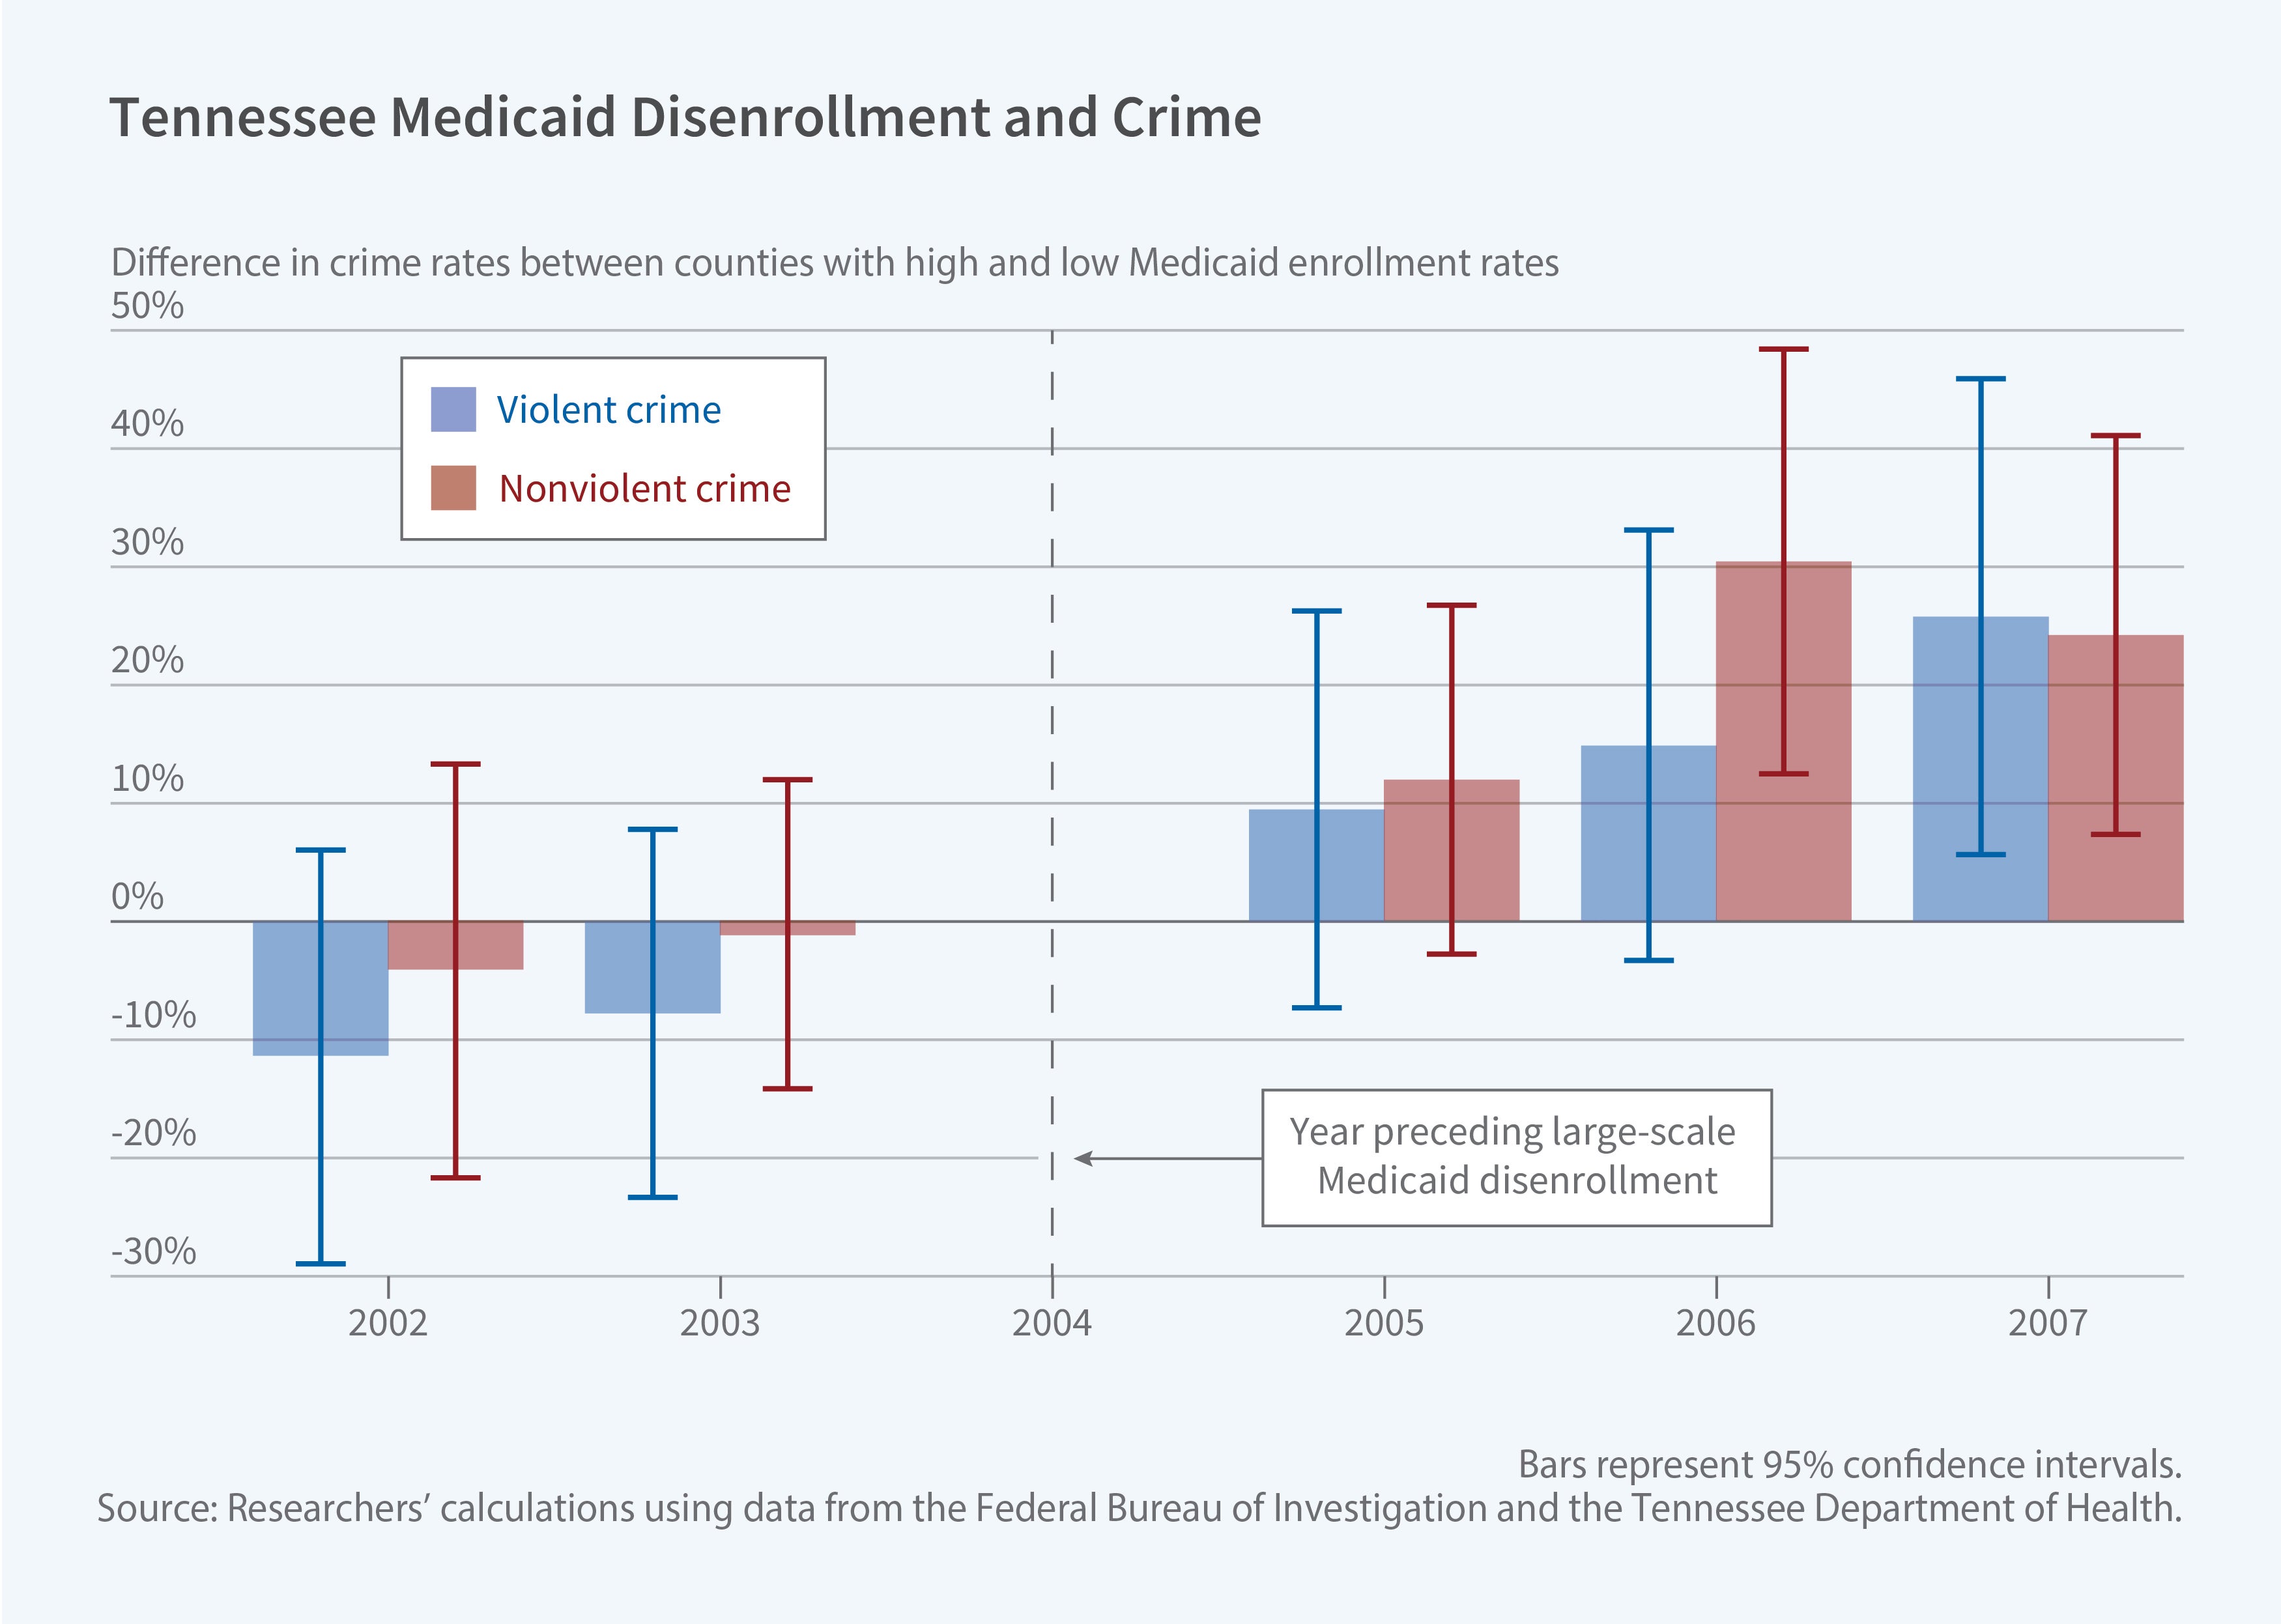
The researchers compared counties in Tennessee where many people lost Medicaid coverage after 2005 to counties where fewer people lost coverage. They looked at crime rate trends before and after 2005 in counties with larger and smaller numbers of people losing Medicaid. The key assumption is that if not for people losing Medicaid, the crime trends would have continued similarly across Tennessee counties after 2005. The researchers attribute any divergence in crime rates between Tennessee counties after 2005 to the differences in the number of people losing Medicaid access as a result of the policy change.
The researchers summarize their findings by describing the policy’s impact on a county with median exposure to disenrollment, namely one where 25.8 percent of the population was covered by Medicaid prior to 2005. They estimate that following disenrollment, such a county would experience an increase in violent crime of 20.6 percent and a rise in nonviolent crime of 14.1 percent per year. Those percentages translate to 65 additional violent crimes and 71 additional nonviolent crimes. Assaults were the main drivers of the increase in violent crimes, and theft was the driver of higher nonviolent crime, based on monthly data from the FBI’s Uniform Crime Reporting for 2002–07.
The researchers suggest that termination of substance use disorder treatment played a crucial role in the increases. Using mortality rates as an indicator of substance use, they find that the median-exposure county experienced a 25 percent increase in drug overdose deaths following TennCare disenrollment. Rates of alcohol-related deaths and deaths by suicide did not rise significantly. The disenrollment roughly coincided with the initial wave of the opioid crisis; fatal opioid overdoses in Tennessee were above the national average.
Missouri also cut its Medicaid rolls in 2005, but the reduction fell on a demographic less likely to commit crimes. While Tennessee disenrolled childless adults who were not disabled or elderly, Missouri tightened income thresholds on traditional Medicaid beneficiaries: working parents, people with disabilities, and seniors. Applying a similar analysis as in the Tennessee study, the researchers found that even though Missouri disenrolled 100,000 people, the impact on crime was generally not statistically significant.
—Steve Maas
Research reported in this publication was supported by the National Institute on Mental Health of the National Institutes of Health under Award Number 1R01MH132552


