Gas-for-Coal Substitution in US Electricity Generation
Coal-fired power plants generate about 20 percent of US electricity. Prioritizing the generation of electricity using natural gas could immediately replace at least two-thirds of coal-fired generation in the US and reduce carbon dioxide emissions from the electricity sector by at least 18 percent. That would correspond to a reduction of between 5 and 8 percent of total US energy-related CO2 emissions, at a cost of $49 to $92 per ton of CO2, according to a new study, On the Feasibility, Costs, and Benefits of an Immediate Phasedown of Coal for US Electricity Generation (NBER Working Paper 32235), by Stephen P. Holland, Matthew Kotchen, Erin T. Mansur, and Andrew J. Yates.
The researchers analyzed 2022 data from the Continuous Emission Monitoring System (CEMS) of the Environmental Protection Agency (EPA), which tracks hourly generation for each fossil fuel powered plant over 25 megawatts. Their sample includes 385 coal fired plants and 2,550 natural gas fired plants. Average hourly generation was 86 gigawatt hours for coal and 143 gigawatt hours for natural gas.
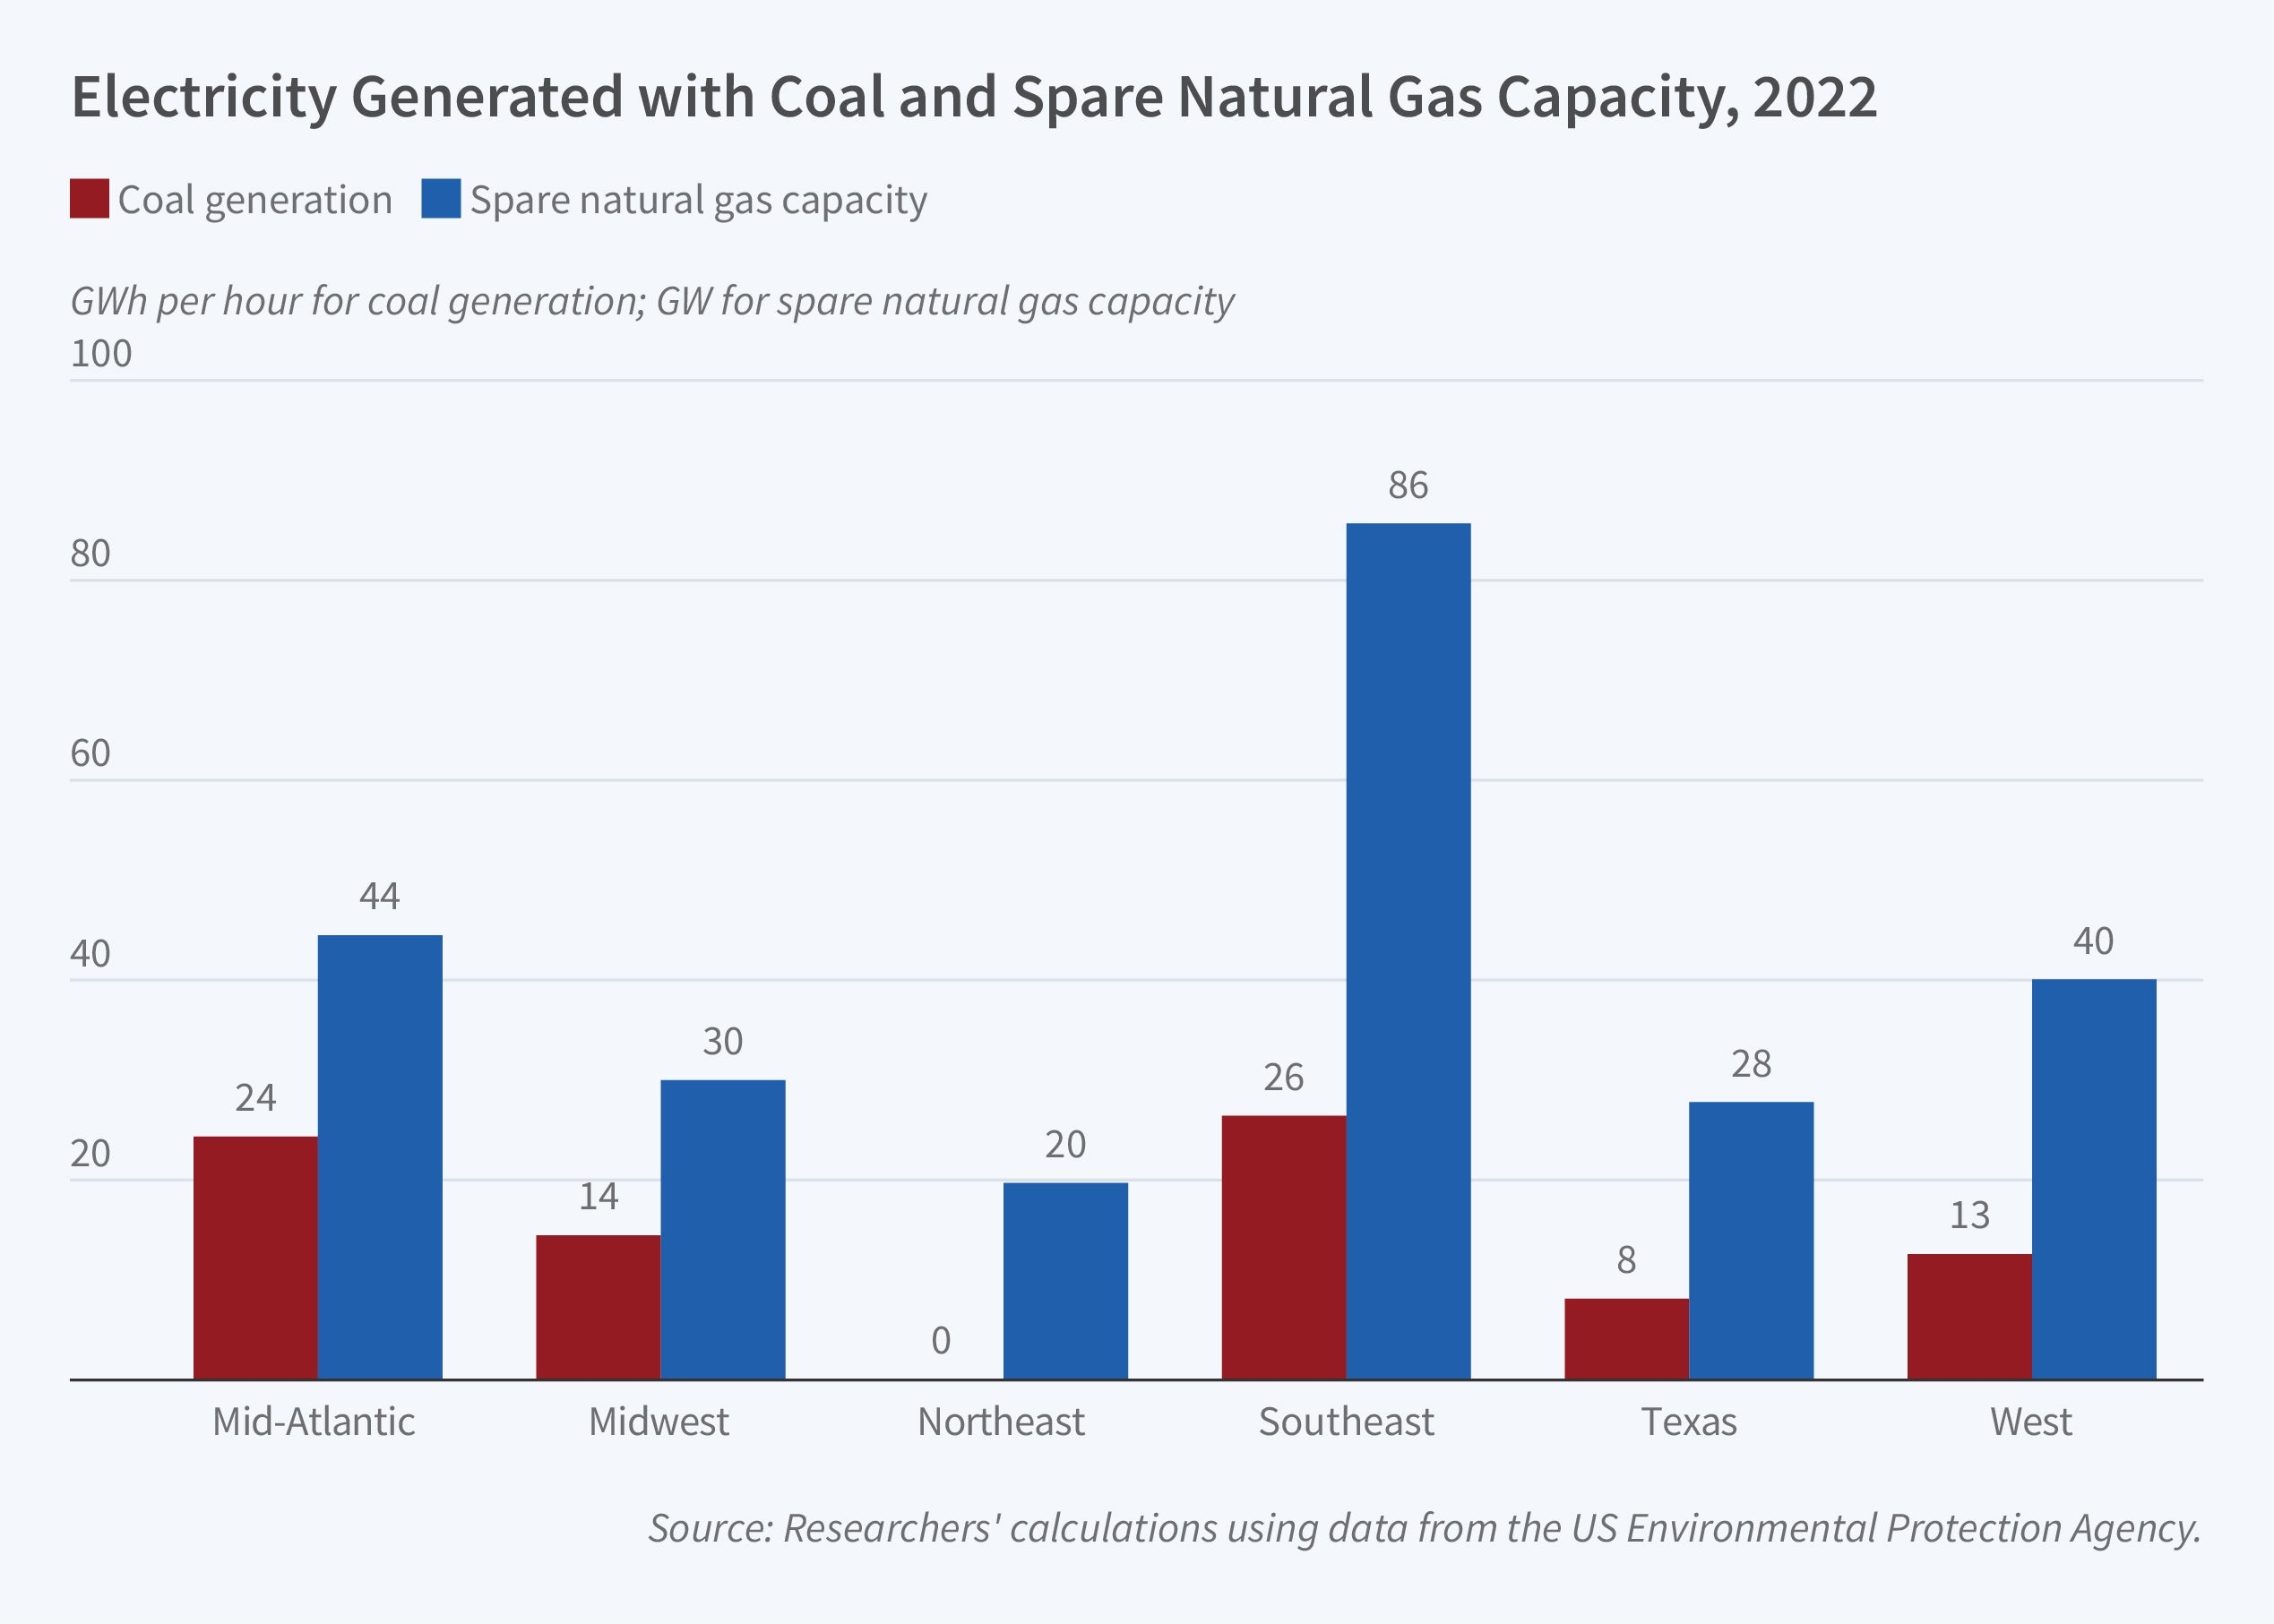
The capacity of each natural gas plant was estimated from data on observed power generation over the previous decade. Hourly spare natural gas capacity was determined by subtracting hourly generation from estimated capacity. For six geographical electricity transmission regions in the US, aggregate spare natural gas capacity substantially exceeds coal generation. This calculation, however, does not account for many constraints that may prevent direct substitution of natural gas for coal. Accordingly, the researchers assume that when a low-cost natural gas plant is not operating, using it to replace coal-fired generation is not feasible because there must be an unobserved constraint that prevented the gas-fired plant from operating. Therefore they assume that only higher-cost natural gas plants within the geographic region are available for replacing coal-fired generation.
Under their preferred counterfactual, in every region but the Northeast, coal is necessary to generate enough electricity to meet demand at least some of the time. In the Mid-Atlantic and Midwest, the natural gas capacity shortfall is between 7 and 8 percent of net load. Coal generation to keep the lights on in Texas and the West would be about 5 percent of net load. In the Southeast it would be less than 1 percent. A key insight, therefore, is that while there appears to be significant scope for existing natural gas units to replace coal for electricity generation, fully eliminating coal while continuing to meet electricity demand is not possible with existing generators.
Assigning priority to gas generation would increase power generation costs by an estimated $20.4 billion a year, with the biggest increases in the Midwest, Southeast, and West. When limitations on pipeline capacity for transporting natural gas are taken into account, the extent of possible coal replacement declines from 94 to 82 percent and the decline in CO2 emissions falls by about 10 percent.
The researchers’ estimate of the cost of eliminating a short ton of CO2 with gas-for-coal substitution is well below the EPA’s estimate of $170 per short ton for the social cost of carbon. There are also significant public health benefits from reducing the local pollutants of sulfur dioxide and nitrogen oxides. Their analysis suggests that despite the increased costs, implementing gas-for-coal substitution given the existing set of electricity generating units is likely to pass a benefit-cost test.
—Linda Gorman


