Positive Externalities from Widespread Irrigation on US High Plains
Downwind cooling effects of agricultural irrigation raise corn and soybean yields and lower mortality related to excess heat.
Adapting to changing climate conditions may have feedback effects on climate and on economic activity. In Cooling Externality of Large-Scale Irrigation (NBER Working Paper 30966), Thomas Braun and Wolfram Schlenker demonstrate that large-scale irrigation has a cooling effect, boosting crop yields and reducing temperature-induced excess mortality in downwind regions.
The researchers study the area covering the Ogallala Aquifer, a 175,000 square mile groundwater reservoir underlying parts of Colorado, Kansas, Nebraska, New Mexico, Oklahoma, South Dakota, Texas, and Wyoming. Large-scale irrigation started with the introduction of the pivot irrigation system in the mid-twentieth century. Geographic features of the aquifer have led to regional variations in the extent of irrigation since 1960: while Nebraska has seen continued growth in its irrigated area, northwestern Texas has progressively decreased irrigation coverage as its portion of the aquifer became depleted.
The researchers combine data on irrigated acres from US Department of Agriculture censuses between 1959 and 2017 with temperature, precipitation, and wind data. They study crop yield data from the National Agricultural Statistics Service, and mortality rates calculated using the Multiple Cause of Death dataset. All variables are aggregated to the county level. The researchers compare monthly temperature percentiles across years, between counties, and between months.
Irrigation is highly seasonal, with water being applied during hot summer months, which allows the researchers to contrast cooling trends in summer months relative to the rest of the year.
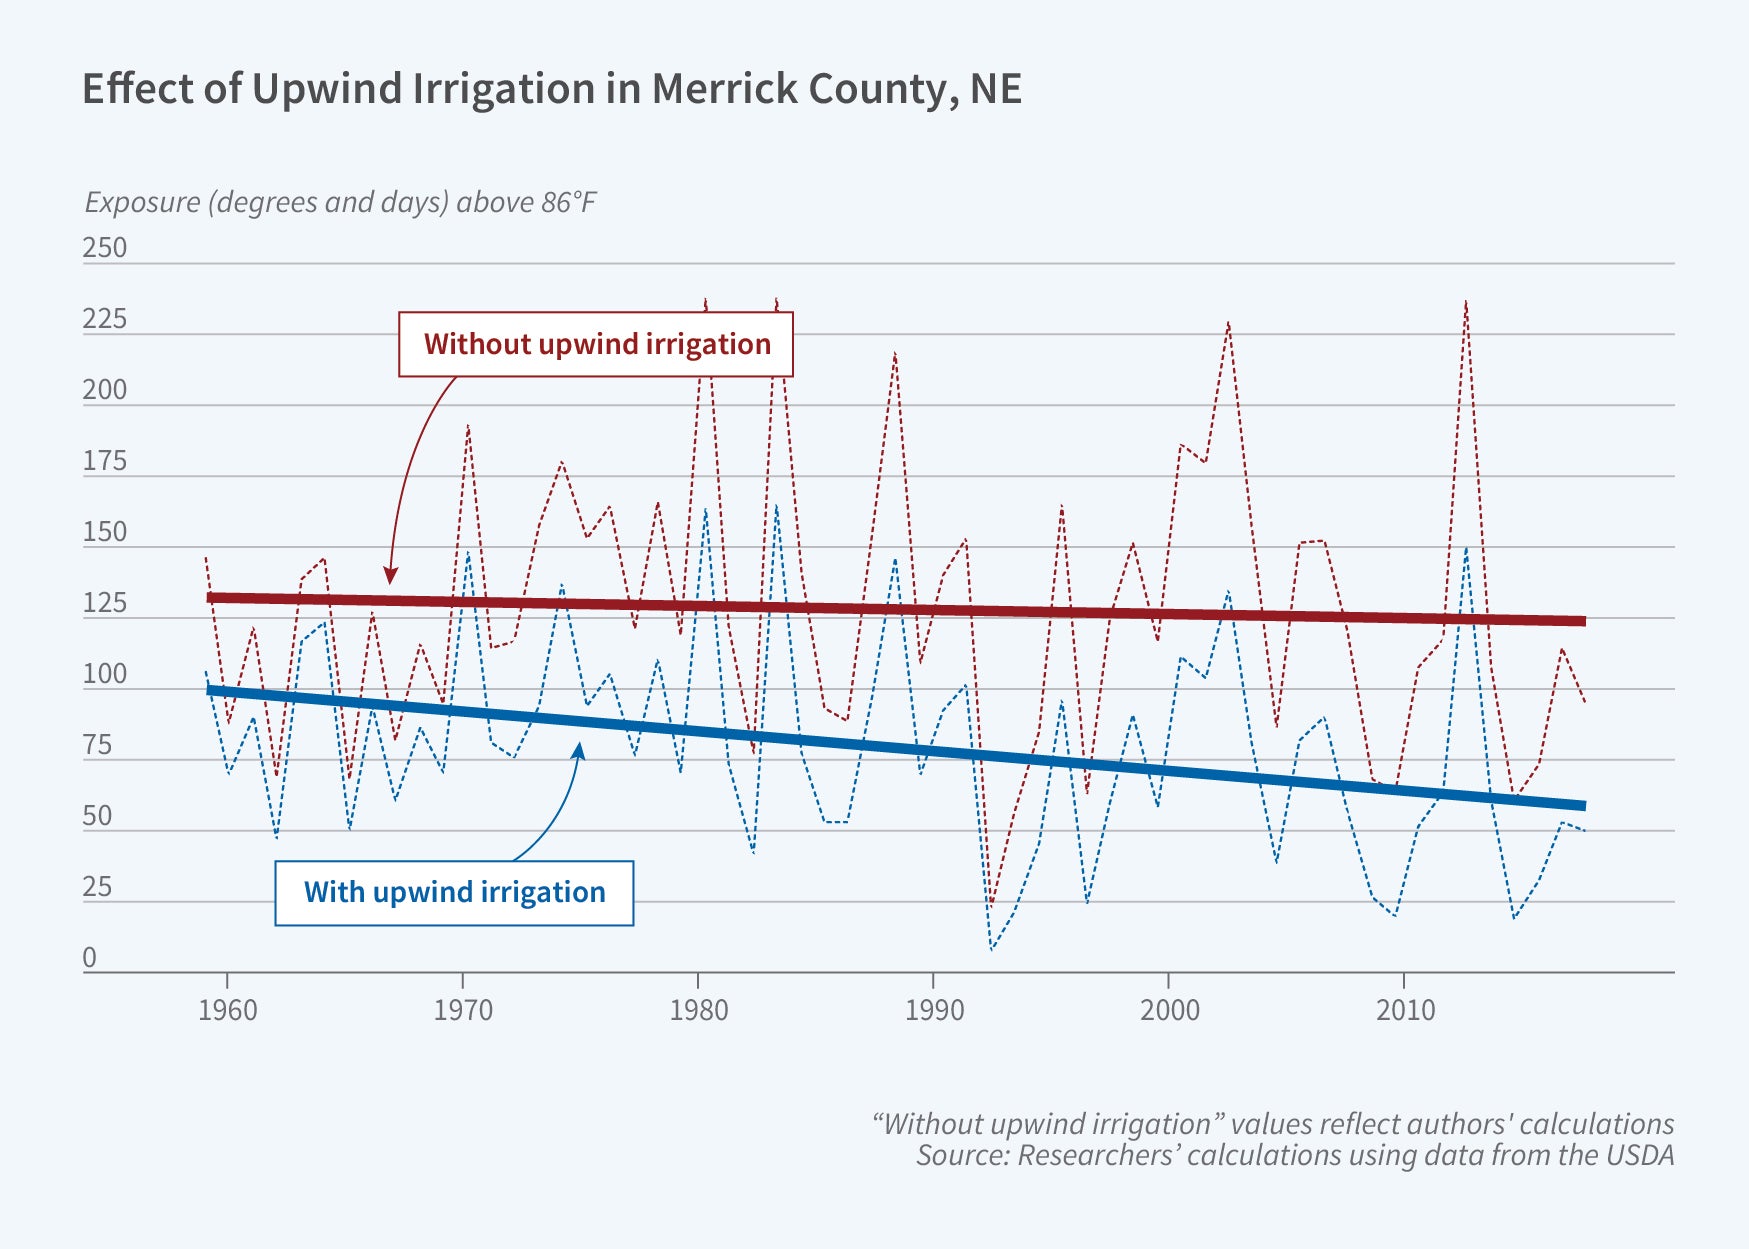
While the study does not find any cooling effect in the county in which irrigation takes place, there is a significant cooling effect, particularly for the hottest temperatures in the summer, which propagates downwind of areas that expanded irrigation. If the entire area of a county is irrigated, its downwind counterpart experiences a 5.5°F drop in the 99th percentile of August temperatures and a 2.6°F drop in the 5th percentile.
This cooling effect on downwind counties has a notable positive impact on crop yields. The researchers calculate that the direct effect of irrigation, in the irrigating counties, raised production by 3.8 billion bushels of corn and 0.6 billion bushels of soybeans over the 1959–2017 period. These increases correspond to more than 5 percent of total production and had an aggregate market value of $26 billion. By comparison, the cooling externality raised corn production by 1.2 billion bushels and soybean production by 0.1 billion bushels. This additional output would have been worth about $7 billion. In some counties, the cooling effect from upwind neighbors generated larger benefits on crop yields than the effect of irrigation in the county itself.
Downwind cooling also significantly reduces heat-related deaths. Based on data from April through September of 1959–1988, each additional 24-hour period with temperature above 95°F was associated with one extra excess death per 100,000. Combining this with the estimates of irrigation-caused temperature declines in downwind areas, the researchers calculate that irrigation led on average to about 27 fewer deaths per summer in the study region, which translates into an aggregate value of $14 billion using the EPA’s Value of a Statistical Life.
While there are benefits to downwind areas from large-scale irrigation, the case of northwestern Texas highlights that such large-scale irrigation is not always possible on a sustained basis.
— Whitney Zhang


