Financial Inclusion and Wellbeing

Despite the US’s well-established banking system, a significant share of the population has limited access to basic financial services that facilitate saving, investing, and preparing for retirement. In Financial Inclusion, Inequality, and Retirement Trends among Older Workers (NBER RDRC Paper NB22-16), Isaac Marcelin and Wei Sun study how financial inclusion affects household wellbeing.
The researchers use data from the Bureau of Economic Analysis and the Health and Retirement Study to construct a county-level index of financial inclusion. Their measure is based on the share of residents who possess various financial products such as checking accounts, IRAs, CDs, savings accounts, mortgages, debts, and pensions; the share who invest in various assets, such as businesses, bonds, and stocks; and local economic indicators such as poverty rates, income-poverty ratios, financial problems, and financial satisfaction.
Residents of counties with greater financial inclusion report more satisfaction with their work and family, lower stress, and fewer drug-related problems.
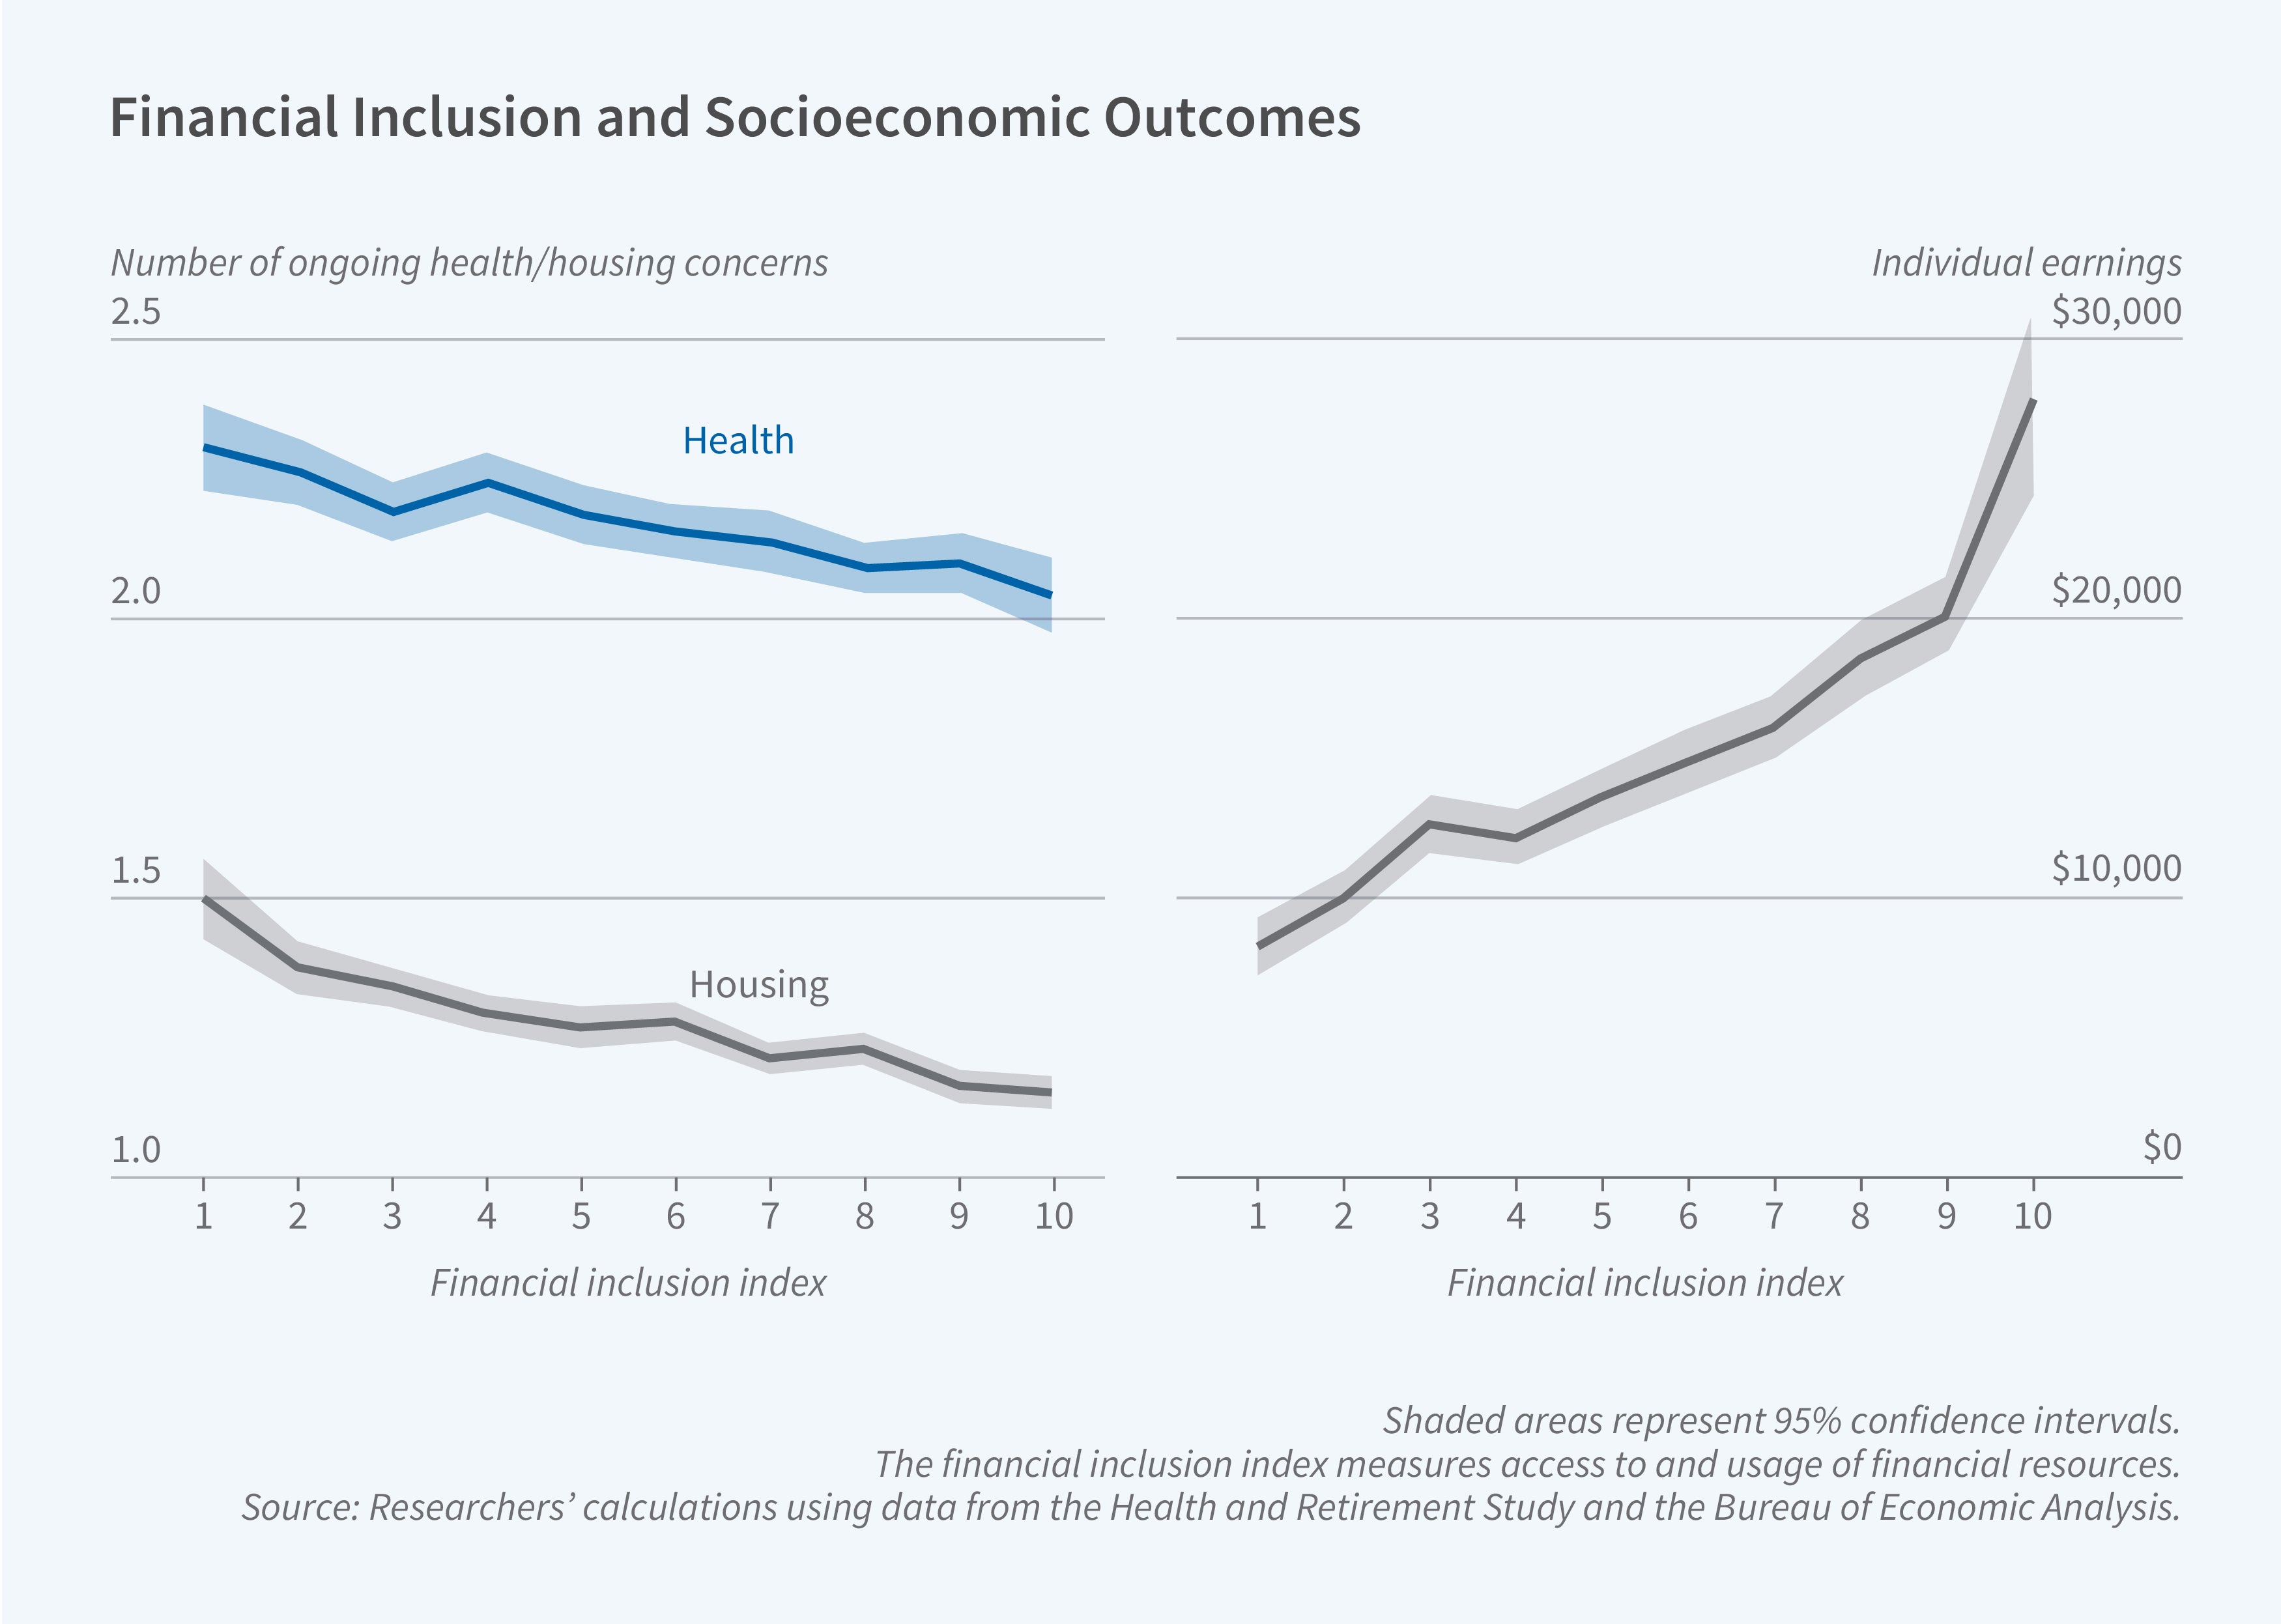
The researchers then use their index to analyze the extent of financial exclusion across the US as well as its effects on households. They find that households in areas with greater financial inclusion tend to have higher incomes and are more likely to own homes and possess real estate wealth. Greater financial inclusion is associated with a higher probability of creating an estate, building intergenerational wealth, and breaking the poverty cycle among married individuals and those with higher levels of educational attainment.
Greater financial inclusion is also associated with better health and life satisfaction. People in counties with greater financial inclusion report more satisfaction with their work and family, lower stress, and fewer drug-related problems. Among African American households living in financially inclusive counties, chronic stress and reports of drug-related issues are 92 percent lower than in counties that are not financially inclusive. The analogous decline for White households is 21 percent, suggesting that financial inclusion may contribute to reducing racial gaps.
Greater financial inclusion is also linked to an increase of over 3 percentage points in the likelihood of women living to the age of 85 and is associated with an increase in the share of married couples and in self-reported satisfaction with earnings.
— Abigail Hiller
The research reported herein was performed pursuant to grant RDR18000003 from the US Social Security Administration (SSA) funded as part of the Retirement and Disability Research Consortium. The opinions and conclusions expressed are solely those of the author(s) and do not represent the opinions or policy of SSA, any agency of the Federal Government, or NBER. Neither the United States Government nor any agency thereof, nor any of their employees, makes any warranty, express or implied, or assumes any legal liability or responsibility for the accuracy, completeness, or usefulness of the contents of this report. Reference herein to any specific commercial product, process or service by trade name, trademark, manufacturer, or otherwise does not necessarily constitute or imply endorsement, recommendation or favoring by the United States Government or any agency thereof.


