Disability Insurance Benefits and Household Composition
Social Security Disability Insurance (DI) “family maximum” rules cap the benefits that can be paid to a disabled worker’s family at the lower of 85 percent of the worker’s average indexed monthly earnings and 150 percent of their primary insurance amount. The effect of these rules is that family payments are the same whether a DI beneficiary has one or many dependents, and when DI beneficiaries have low benefit determinations, there are no payments for dependents at all.
In Understanding the Disparate Impacts of the Social Security Disability Insurance Family Maximum Rules (NBER RDRC Paper NB23-07), Timothy J. Moore examines how the economic wellbeing of DI beneficiary households varies with the number of children and the presence of a spouse. Utilizing data from the Consumer Expenditure Survey (2010–19) and the National Beneficiary Survey (2017, 2019), Moore analyzes a sample of US households headed by adults under age 60 with between one and four dependents.
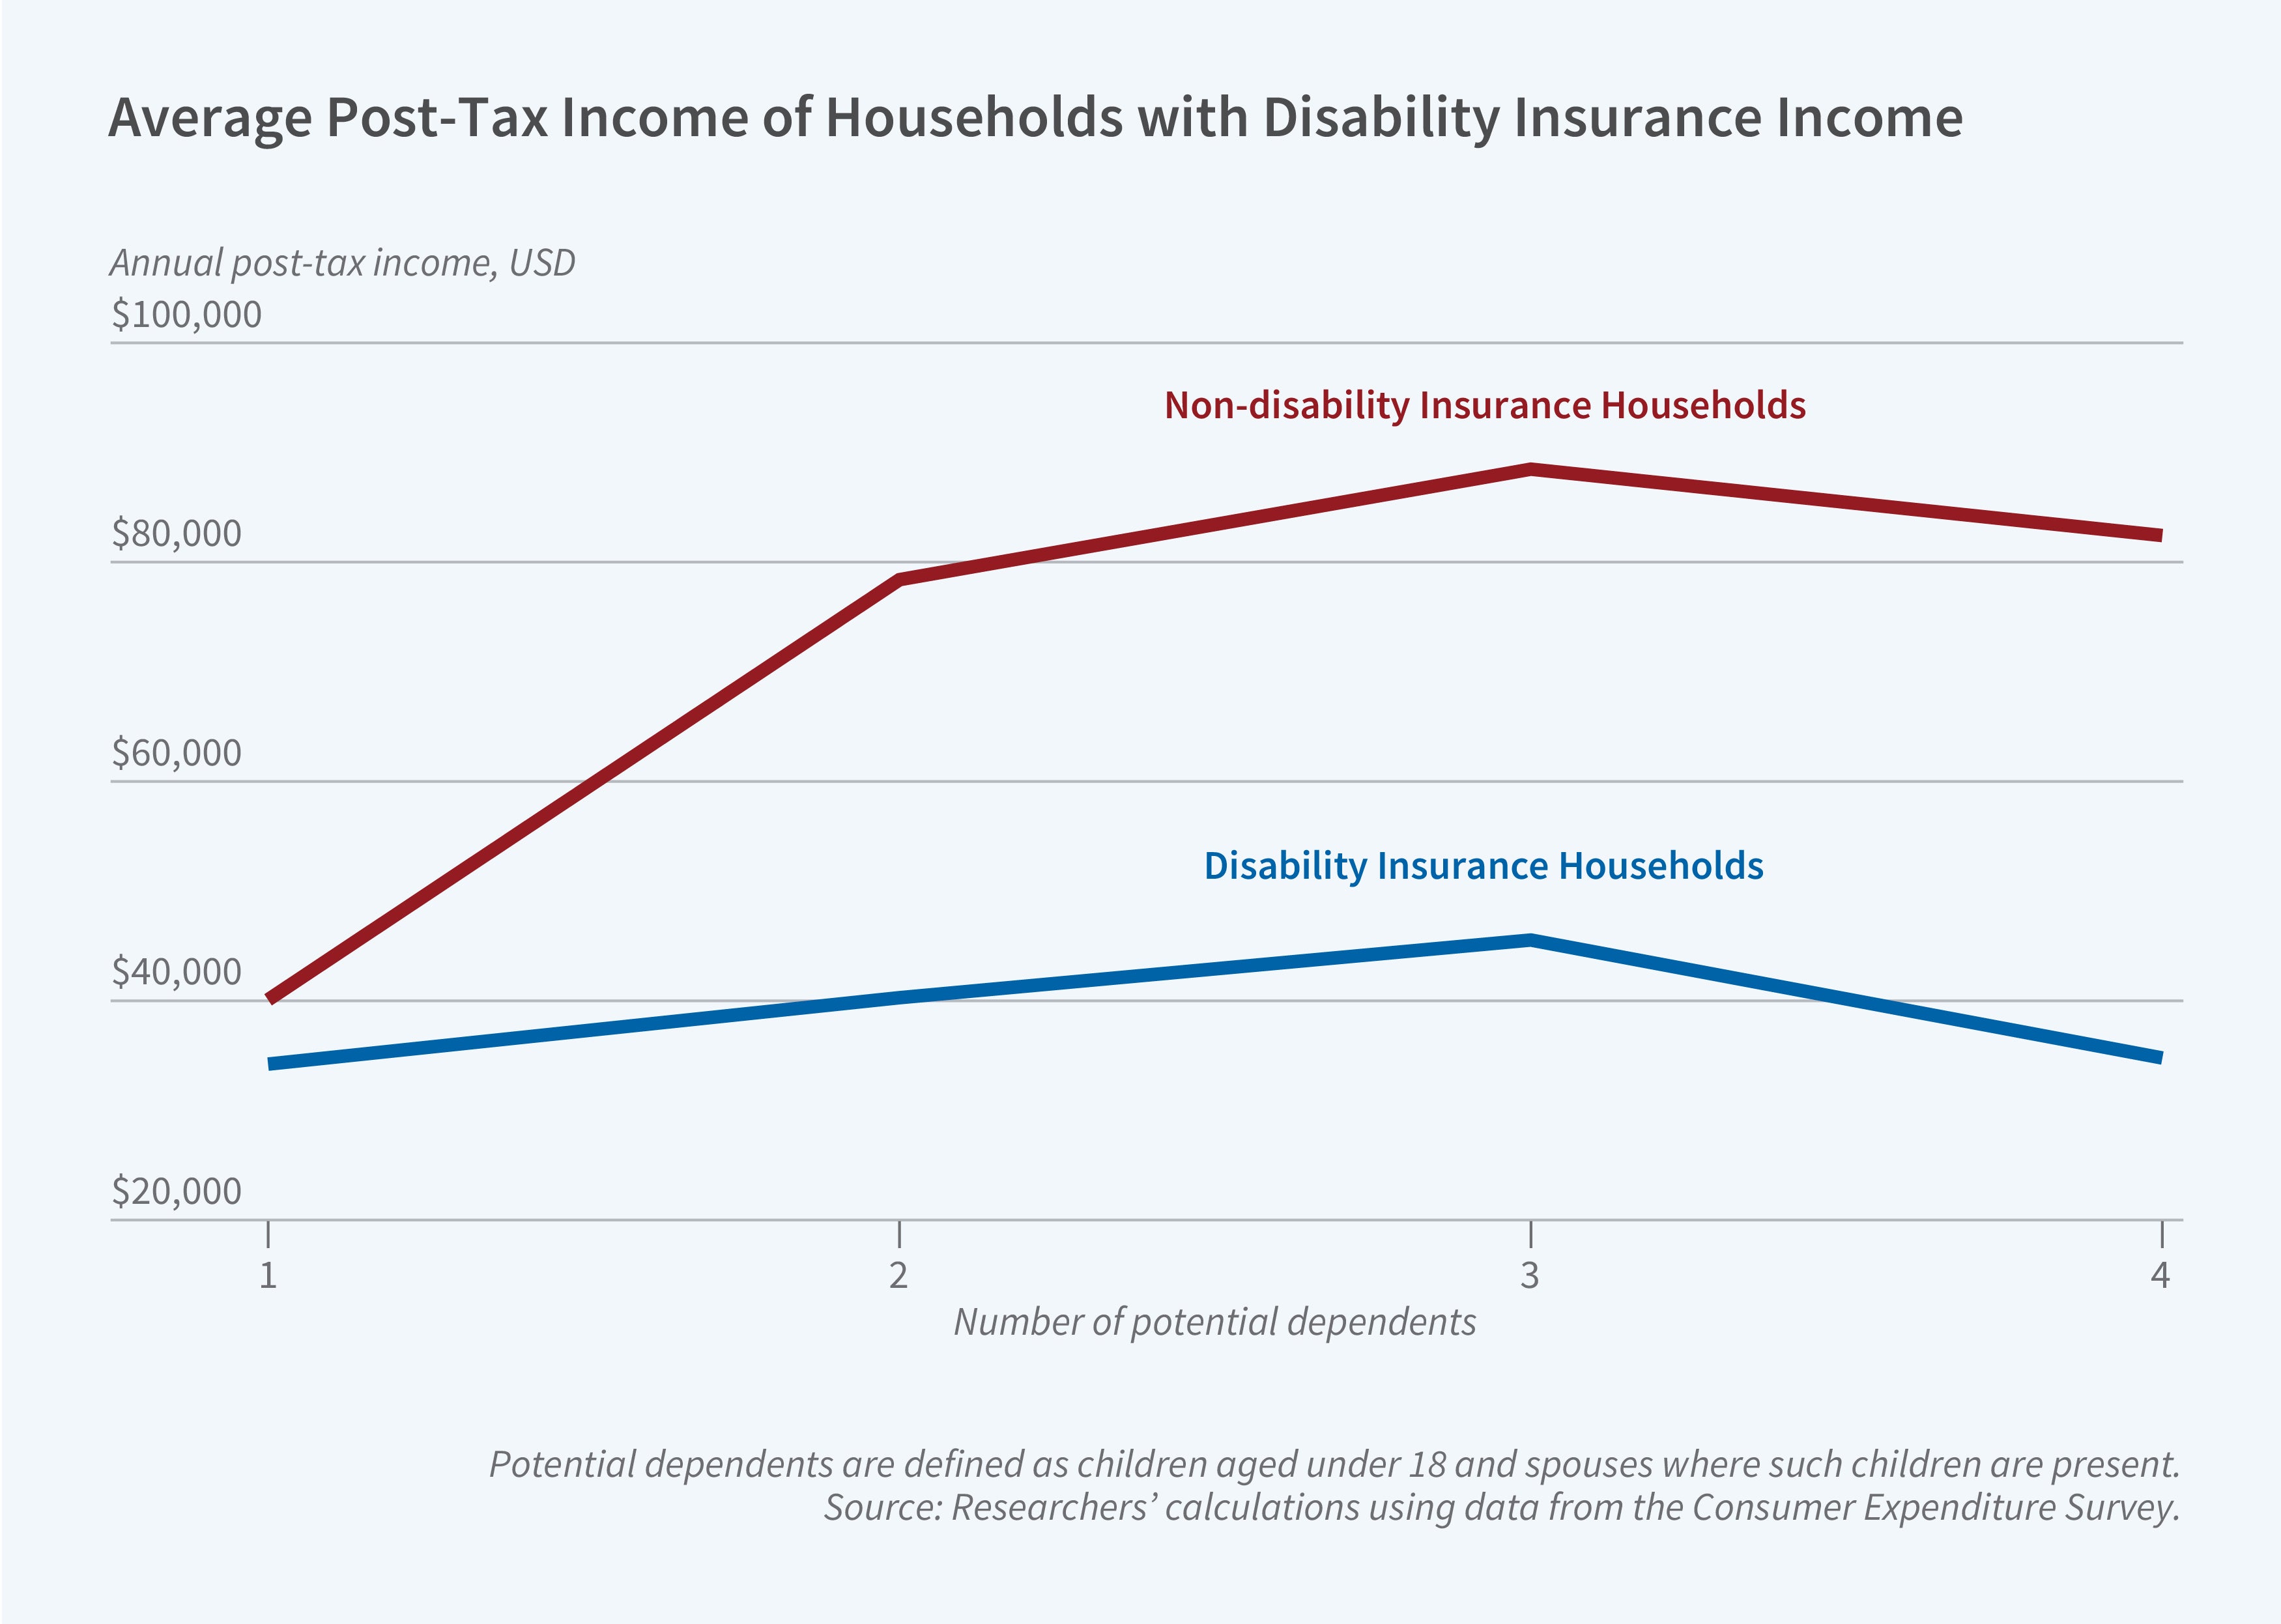
The income gap between households that do and do not receive DI widens as the number of dependents rises. The largest DI families have the lowest incomes.
He finds substantial income and expenditure gaps between DI and non-DI households, with a growing gap as the number of dependents increases. DI households with one dependent average post-tax incomes equivalent to 85 percent of those of their non-DI counterparts. For households with more than one dependent, however, DI household incomes average between 40 and 51 percent of the income of non-DI households.
In households with the same number of children, the median income for unmarried DI beneficiaries ranges between 40 and 67 percent of that of married beneficiaries. Unmarried DI beneficiary households with three or more children have the lowest absolute income, with a median of around $16,000.
DI families with more dependents are more likely to report struggling to meet basic needs, with the poverty rate increasing with the number of children. Around 80 percent of households headed by unmarried DI beneficiaries with three or more children fall below the poverty line. Homeownership rates are also lower for these larger households than for their smaller counterparts.
The findings suggest that the DI program, which pays similar benefits regardless of the number of children in a household, provides more economic security to households with fewer dependents.
— Leonardo Vasquez
The research reported herein was performed pursuant to grant RDR18000003 from the US Social Security Administration (SSA) funded as part of the Retirement and Disability Research Consortium. The opinions and conclusions expressed are solely those of the author(s) and do not represent the opinions or policy of SSA, any agency of the Federal Government, or NBER. Neither the United States Government nor any agency thereof, nor any of their employees, makes any warranty, express or implied, or assumes any legal liability or responsibility for the accuracy, completeness, or usefulness of the contents of this report. Reference herein to any specific commercial product, process or service by trade name, trademark, manufacturer, or otherwise does not necessarily constitute or imply endorsement, recommendation or favoring by the United States Government or any agency thereof.


