C-section Rates and Birth Outcomes

Cesarean section (C-section) is the most common surgical procedure performed in the United States. Sarah Robinson, Heather Royer, and David Silver report that C-section rates for first-time, singleton births increased from 24 percent to 32 percent between 1989 and 2017 alongside significant changes in medical practices during this period. In 2001, for example, the American College of Obstetricians and Gynecologists began recommending C-sections for breech births. The rising rate of C-sections has sparked a debate about whether this procedure is being overused.
In Geographic Variation in Cesarean Sections in the United States: Trends, Correlates, and Other Interesting Facts (NBER Working Paper 31871), the researchers study how cross-county differences in C-section usage correlate with infant and maternal health outcomes, measured by neonatal mortality (deaths within the first 28 days), infant morbidity (birth complications like assisted ventilation), and maternal morbidity (delivery complications like unplanned hysterectomies). Using data for 2,346 US counties, they categorize births as either high- or low-risk based on factors such as preterm birth, maternal age, and medical conditions.
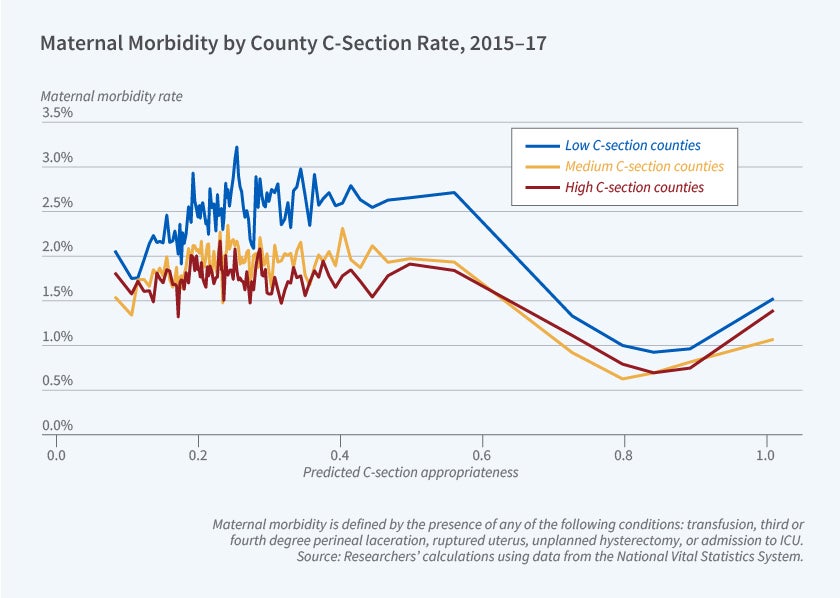
US counties with greater rates of C-sections are associated with lower rates of infant and maternal morbidity, suggesting increased usage could lead to improved natal welfare.
Geographic patterns in C-section rates persist over time, and counties with elevated C-section rates for high-risk births also have elevated rates for low-risk births. For high-risk births, counties with higher C-section rates had higher neonatal mortality rates at the beginning of the data sample. A 10 percentage point increase in the C-section rate was associated with a 3 percent increase in the number of neonatal deaths per 1,000 births (0.41 deaths). The relationship between C-section rates and high-risk birth outcomes was much weaker at the end of the sample. For low-risk births, neonatal mortality and C-section rates were only weakly positively linked at the start of the sample, and they exhibited a negative association at the end of the sample.
Infant and maternal morbidity are lower in counties with higher C-section rates, despite those counties serving more economically disadvantaged populations. A 10 percentage point higher C-section rate is associated with 12 to 18 percent lower infant morbidity and 14 to 32 percent lower maternal morbidity.
The researchers also study the relationship between individual-level characteristics, C-section use, and health outcomes, controlling for county of residence. Among mothers with over a 60 percent predicted probability of a C-section, Black mothers had lower C-section rates but higher neonatal mortality, infant morbidity, and maternal morbidity compared to White mothers. In contrast, for mothers with under a 60 percent predicted probability, the patterns reversed, with higher C-section rates for Blacks but equal or better outcomes relative to Whites. These results suggest potential overuse of C-sections for low-risk Black mothers and underuse of C-sections for high-risk Black mothers.
— Leonardo Vasquez
The researchers acknowledge financial support from a National Institute on Aging grant to the NBER (T32-AG000186).


