What Can We Learn about COVID-19 Infection Rates and Infection Fatality Rates without Randomized Testing?
One of the statistical challenges of the COVID-19 pandemic has been determining what proportion of the population has been infected with it. While we know how many people have received a positive test result, most have not been tested and tests do not have perfect accuracy.
A lack of information on the number of infections complicates our understanding of the virus. The infection fatality rate, an important indicator of the health risk associated with a COVID-19 infection, is the proportion of the infected population that has died. It cannot be calculated without an accurate count of infections. Two recent working papers have introduced methods for using currently available information to better understand infection rates.
In Estimating the Covid-19 Infection Rate: Anatomy of an Inference Problem (NBER Working Paper 27023), subsequently published in the Journal of Econometrics, Charles F. Manski and Francesca Molinari generate upper and lower bounds on the rates of COVID-19 infection under minimal assumptions. They apply their methodology to available data from Illinois, New York, and Italy.
Their bounds rely on two key pieces of information: the percentage of people who have been tested and the percentage of positive test results among those who were tested. They augment this information with a few necessary assumptions. They assume that the infection rate among those who are tested is higher than the rate among those who are not, a plausible assumption given that testing has been concentrated among individuals who display symptoms, and they make assumptions about the degree of accuracy of the tests.
The resulting bounds on the COVID-19 infection rate are quite wide, with plausible infection rates in New York, as of April 6, 2020, ranging from 0.8 percent of the population to 64.5 percent. The bounds for Illinois and Italy are narrower but encompass rates as high as 51.7 percent and 51.0 percent, respectively. The researchers highlight that the wide bounds on the infection rates are primarily attributable to the small proportion of the population that had been tested at that time, ranging from 0.5 percent of the population in Italy to 1.7 percent of the population in New York.
These findings suggest that, in the absence of strong assumptions, the bounds around the infection rate are necessarily wide. However, even these wide bounds contain useful information. For instance, 12.5 percent of confirmed cases resulted in death as of April 6th in Italy. However, the researchers’ bounds on infection rates on the same date imply a lower infection fatality rate, ranging from 0.1 percent to 8.6 percent of infected individuals.
In a second paper, Estimating the Fraction of Unreported Infections in Epidemics with a Known Epicenter: An Application to COVID-19 (NBER Working Paper 27028), researchers Ali Hortaçsu, Jiarui Liu, and Timothy Schwieg develop an approach to estimating the number of unreported infections based on travel patterns. They argue that initial infections in most locations arose from travelers arriving from the virus epicenters, and they assume that the proportion of travelers from the epicenters who were infected was the same among travelers to all destinations. Initial infections in any destination are therefore proportional to the number of travelers arriving from the epicenters.
Their approach is aided by (but does not require) data on infection rates derived from universal or randomized testing at one of the destinations. In their application of the methodology, the researchers leverage data from randomized testing in Iceland. They assume that disease transmission rates from infected travelers are the same in Iceland as in the other destinations that are analyzed: 20 counties in the United States.
The main results suggest that, as of March 13th, only 4 percent of infections in the United States were confirmed by positive tests. This implies that for each confirmed infection, there were 22 unconfirmed ones.
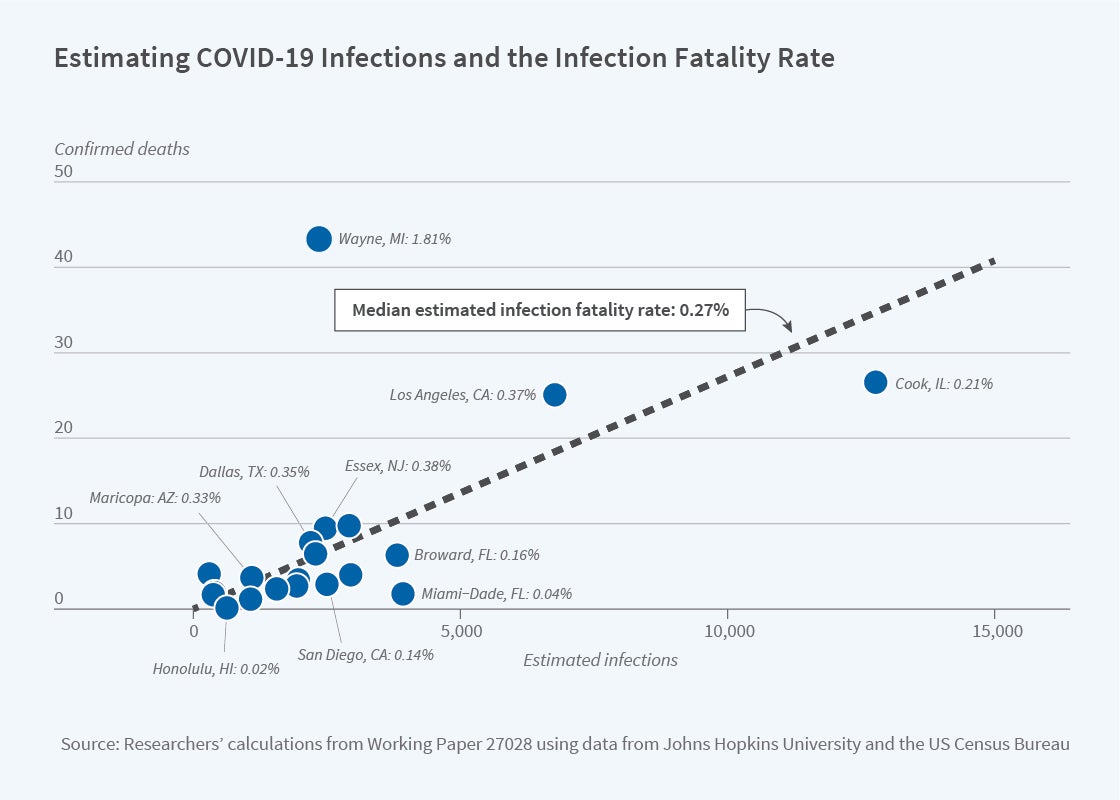
This information can be used to infer an infection fatality rate. The median implied infection fatality rate — across the 20 counties — is 0.27 percent, reflected in the dashed line on the figure. As seen in the figure, the estimated infection fatality rate varies geographically, ranging from 0.02 percent in Honolulu County, Hawaii to 1.81 percent in Wayne County, Michigan. In all locations, however, the implied infection fatality rates are substantially lower than the fatality rates among confirmed cases.
This methodology requires stronger assumptions and more data than Manski and Molinari’s. Hortaçsu, Liu and Schwieg make clear that their results are "dependent on strong assumptions and accurate data on travel patterns, and that any results are very sensitive to these assumptions."
Both groups of researchers emphasize that their methods are not a substitute for universal or randomized testing. However, in the absence of such testing, these working papers demonstrate what can be learned about infection rates and infection fatality rates from information that is more readily available.


