Immigrant Entrepreneurship in the US
Immigrants to the US are more entrepreneurial than the native population and overrepresented among high-growth startups and venture-backed tech firms. In Immigrant Entrepreneurship: New Estimates and a Research Agenda (NBER Working Paper 32400), Saheel Chodavadia, Sari Pekkala Kerr, William Kerr, and Louis Maiden use business surveys and administrative employment records to provide new evidence on the prevalence and predictors of immigrant entrepreneurship.
Measuring the prevalence of immigrant entrepreneurship is difficult because administrative datasets, including linked employer-employee datasets developed by various government agencies, do not always distinguish natives from immigrants and/or lack reliable ways to detect entrepreneurial business creation. Self-employment is one proxy for entrepreneurship. In the American Community Survey, immigrants constitute 21.5 percent of self-employed workers over the 2016–2020 period. Among new business owners in the Annual Business Surveys 2014–2019, the immigrant share is 24.2 percent. This was up from 18.7 percent in 2007 data.
Immigrants accounted for about 24 percent of entrepreneurs in 2019, up from 19 percent in 2007.
The researchers also analyze data from the Longitudinal Employer-Household Dynamics (LEHD) database. They proxy for entrepreneurs by isolating the three highest earning initial workers at a newly created single-unit firm in the year of its entry. The LEHD database suggests that the immigrant share of entrepreneurship rose from 22.5 percent in 2003 to 28.9 percent in 2020. Across the disparate techniques, the immigrant shares are consistently above 20 percent, compared to immigrants being about 14–15 percent of the population, and the immigrant founder share can exceed 40 percent when looking at leading AI-related or venture-capital backed firms.
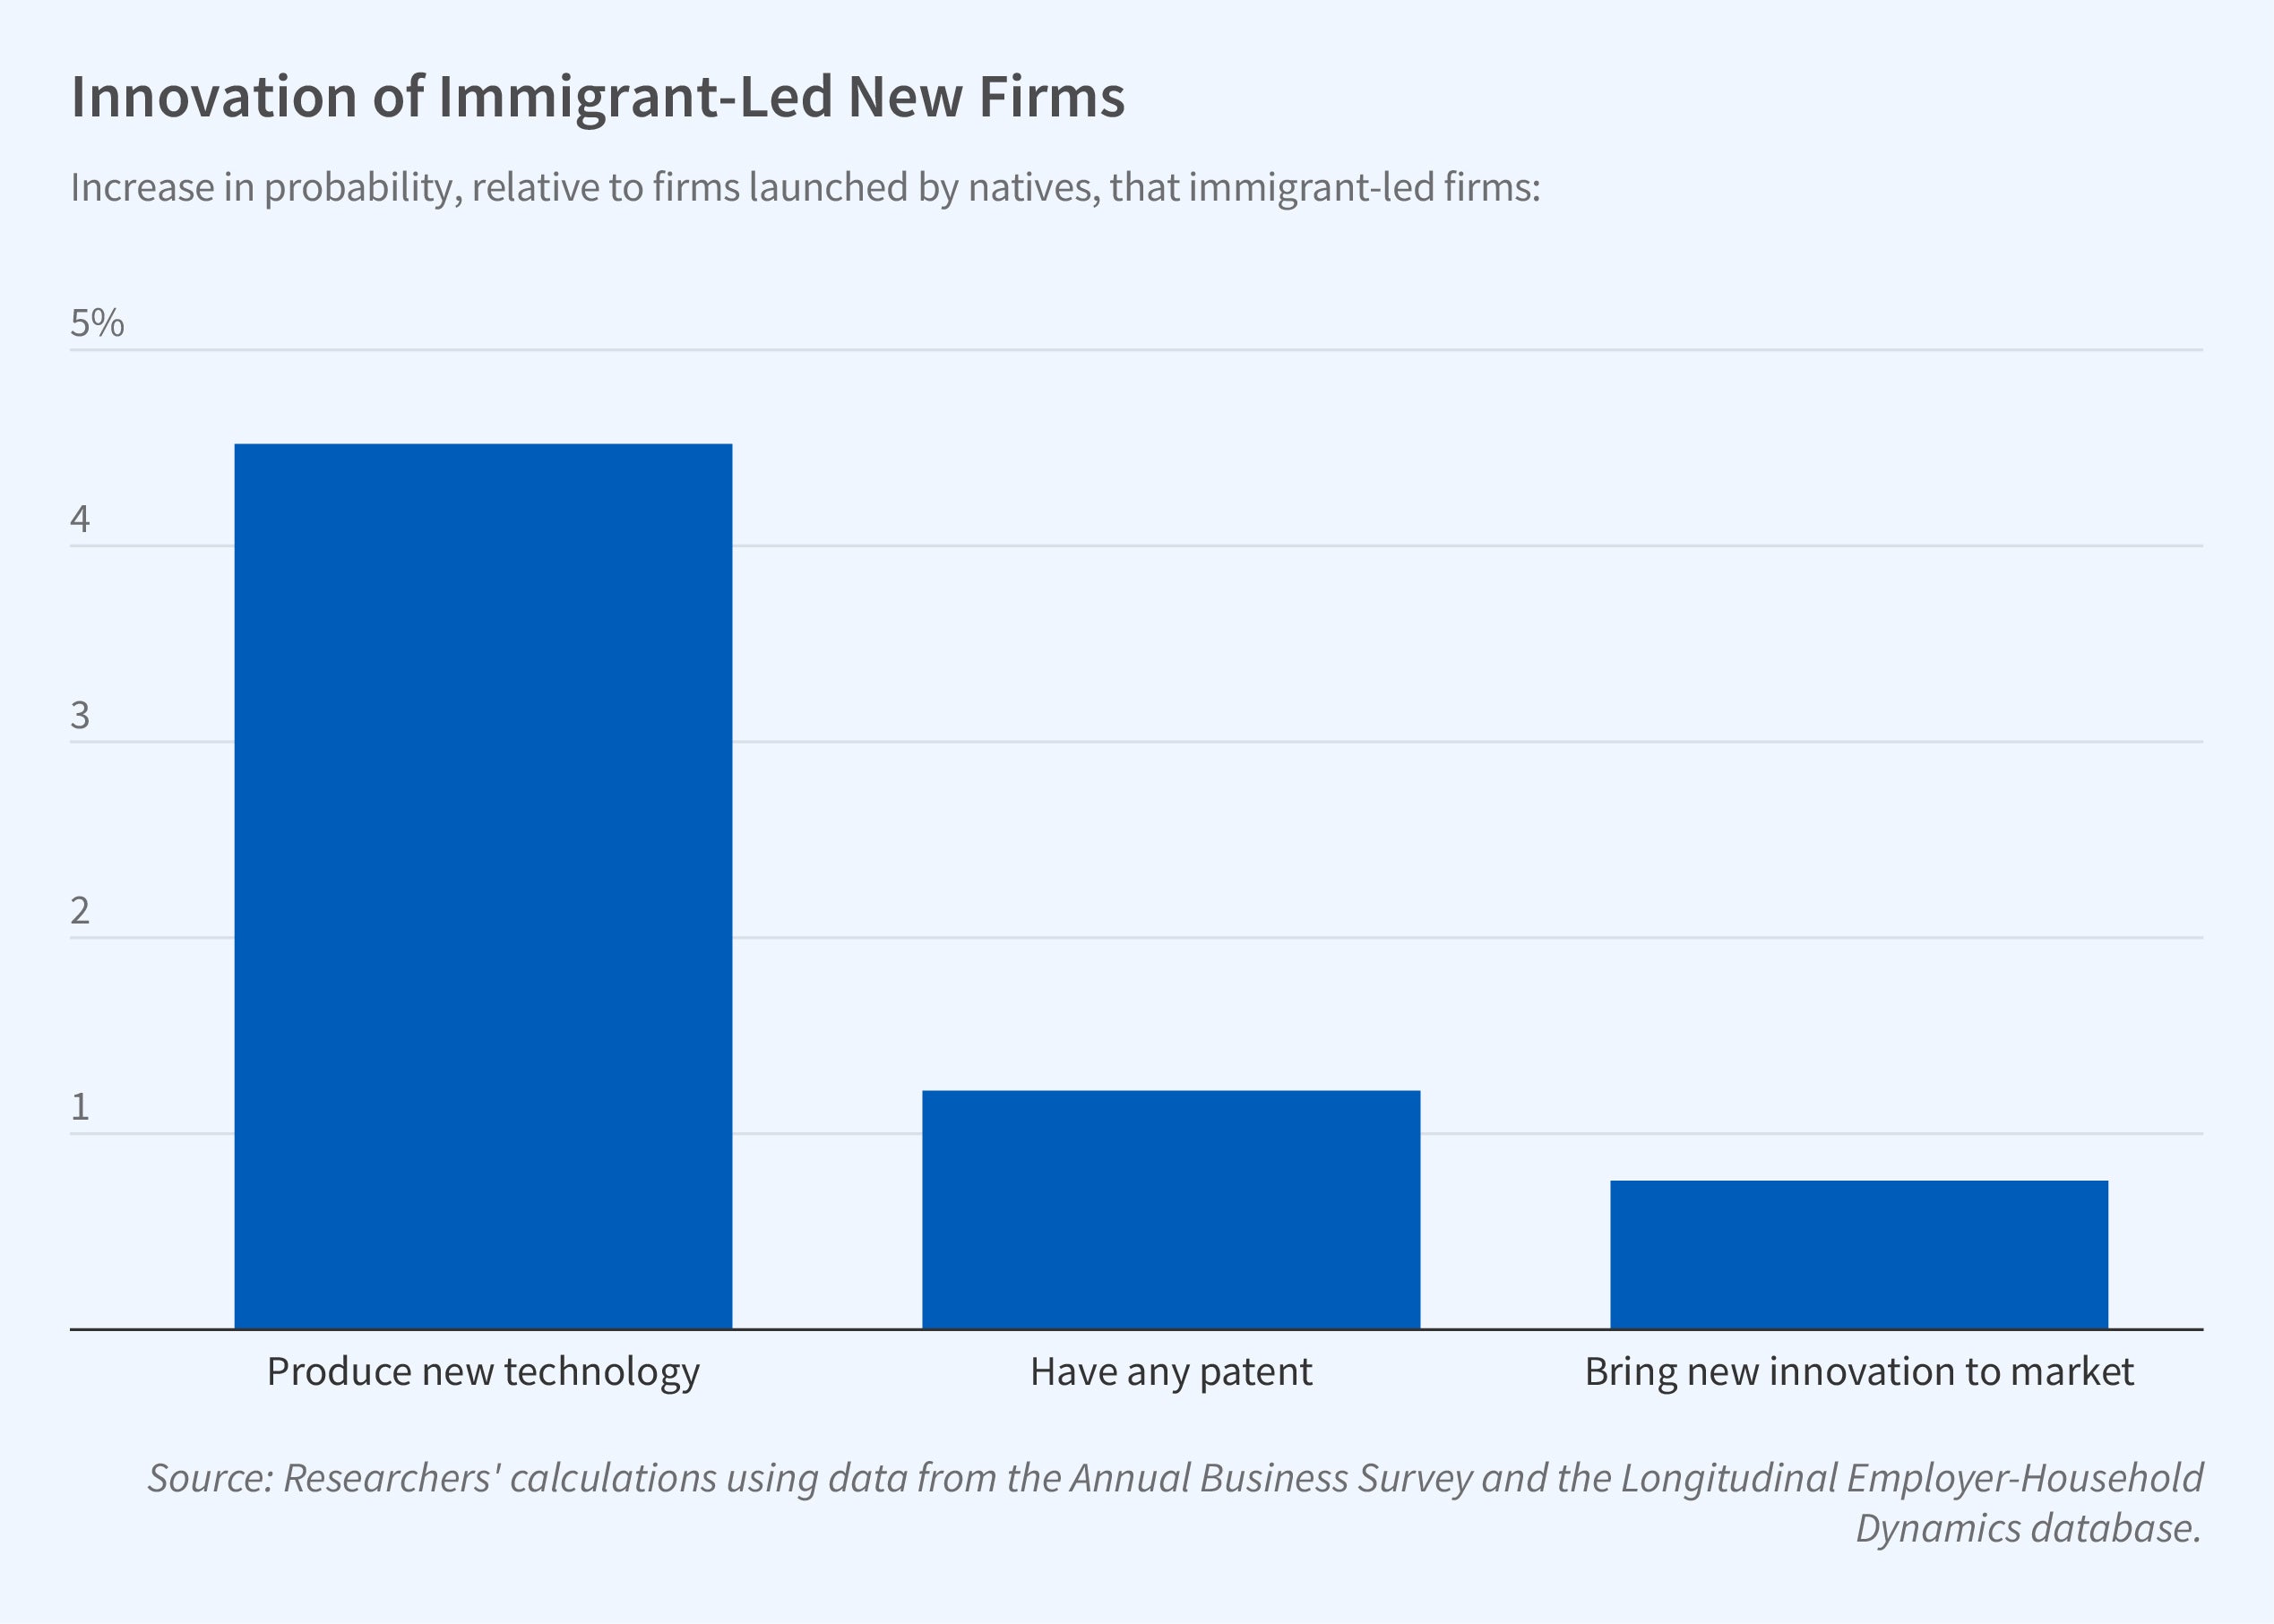
The researchers also find that immigrant-owned firms generate more patents per worker and are more likely to produce and bring to market innovations or new technologies. Education levels and different field-of-study choices of immigrants versus natives can partly account for these differences, but they do not fully explain the higher innovation rates of immigrant-led startups.
Immigration policies affect immigrant entrepreneurship. Future entrepreneurs often enter the US by attending a US university, but restrictive visa policies prevent many aspiring entrepreneurs from founding a firm after graduation. The researchers conclude by referring to several previous studies that find positive impacts on immigrant entrepreneurship of programs such as points-based visa systems, visa systems that favor self-employed workers or entrepreneurs, and efforts to attract foreign entrepreneurs to visit a country.
— Shakked Noy
The researchers gratefully acknowledge funding support by Ewing Marion Kauffman Foundation and Harvard Business School. This research was performed at a Federal Statistical Research Data Center under FSRDC Project Numbers 1182, 1731, and 2766. (Request 5948, 8512, CBDRB-FY23-P1731-R10666, CBDRB-FY24-P1731-R11027, CBDRB-FY23-P2766-R10877, and CBDRB-FY23-P2766-R10856). This research uses data from the Census Bureau's Longitudinal Employer-Household Dynamics Database, which was partially supported the National Science Foundation Grants SES-9978093, SES-0339191 and ITR-0427889; National Institute on Aging Grant AG018854; and grants from the Alfred P. Sloan Foundation.


