The Stagnation of US Construction Productivity
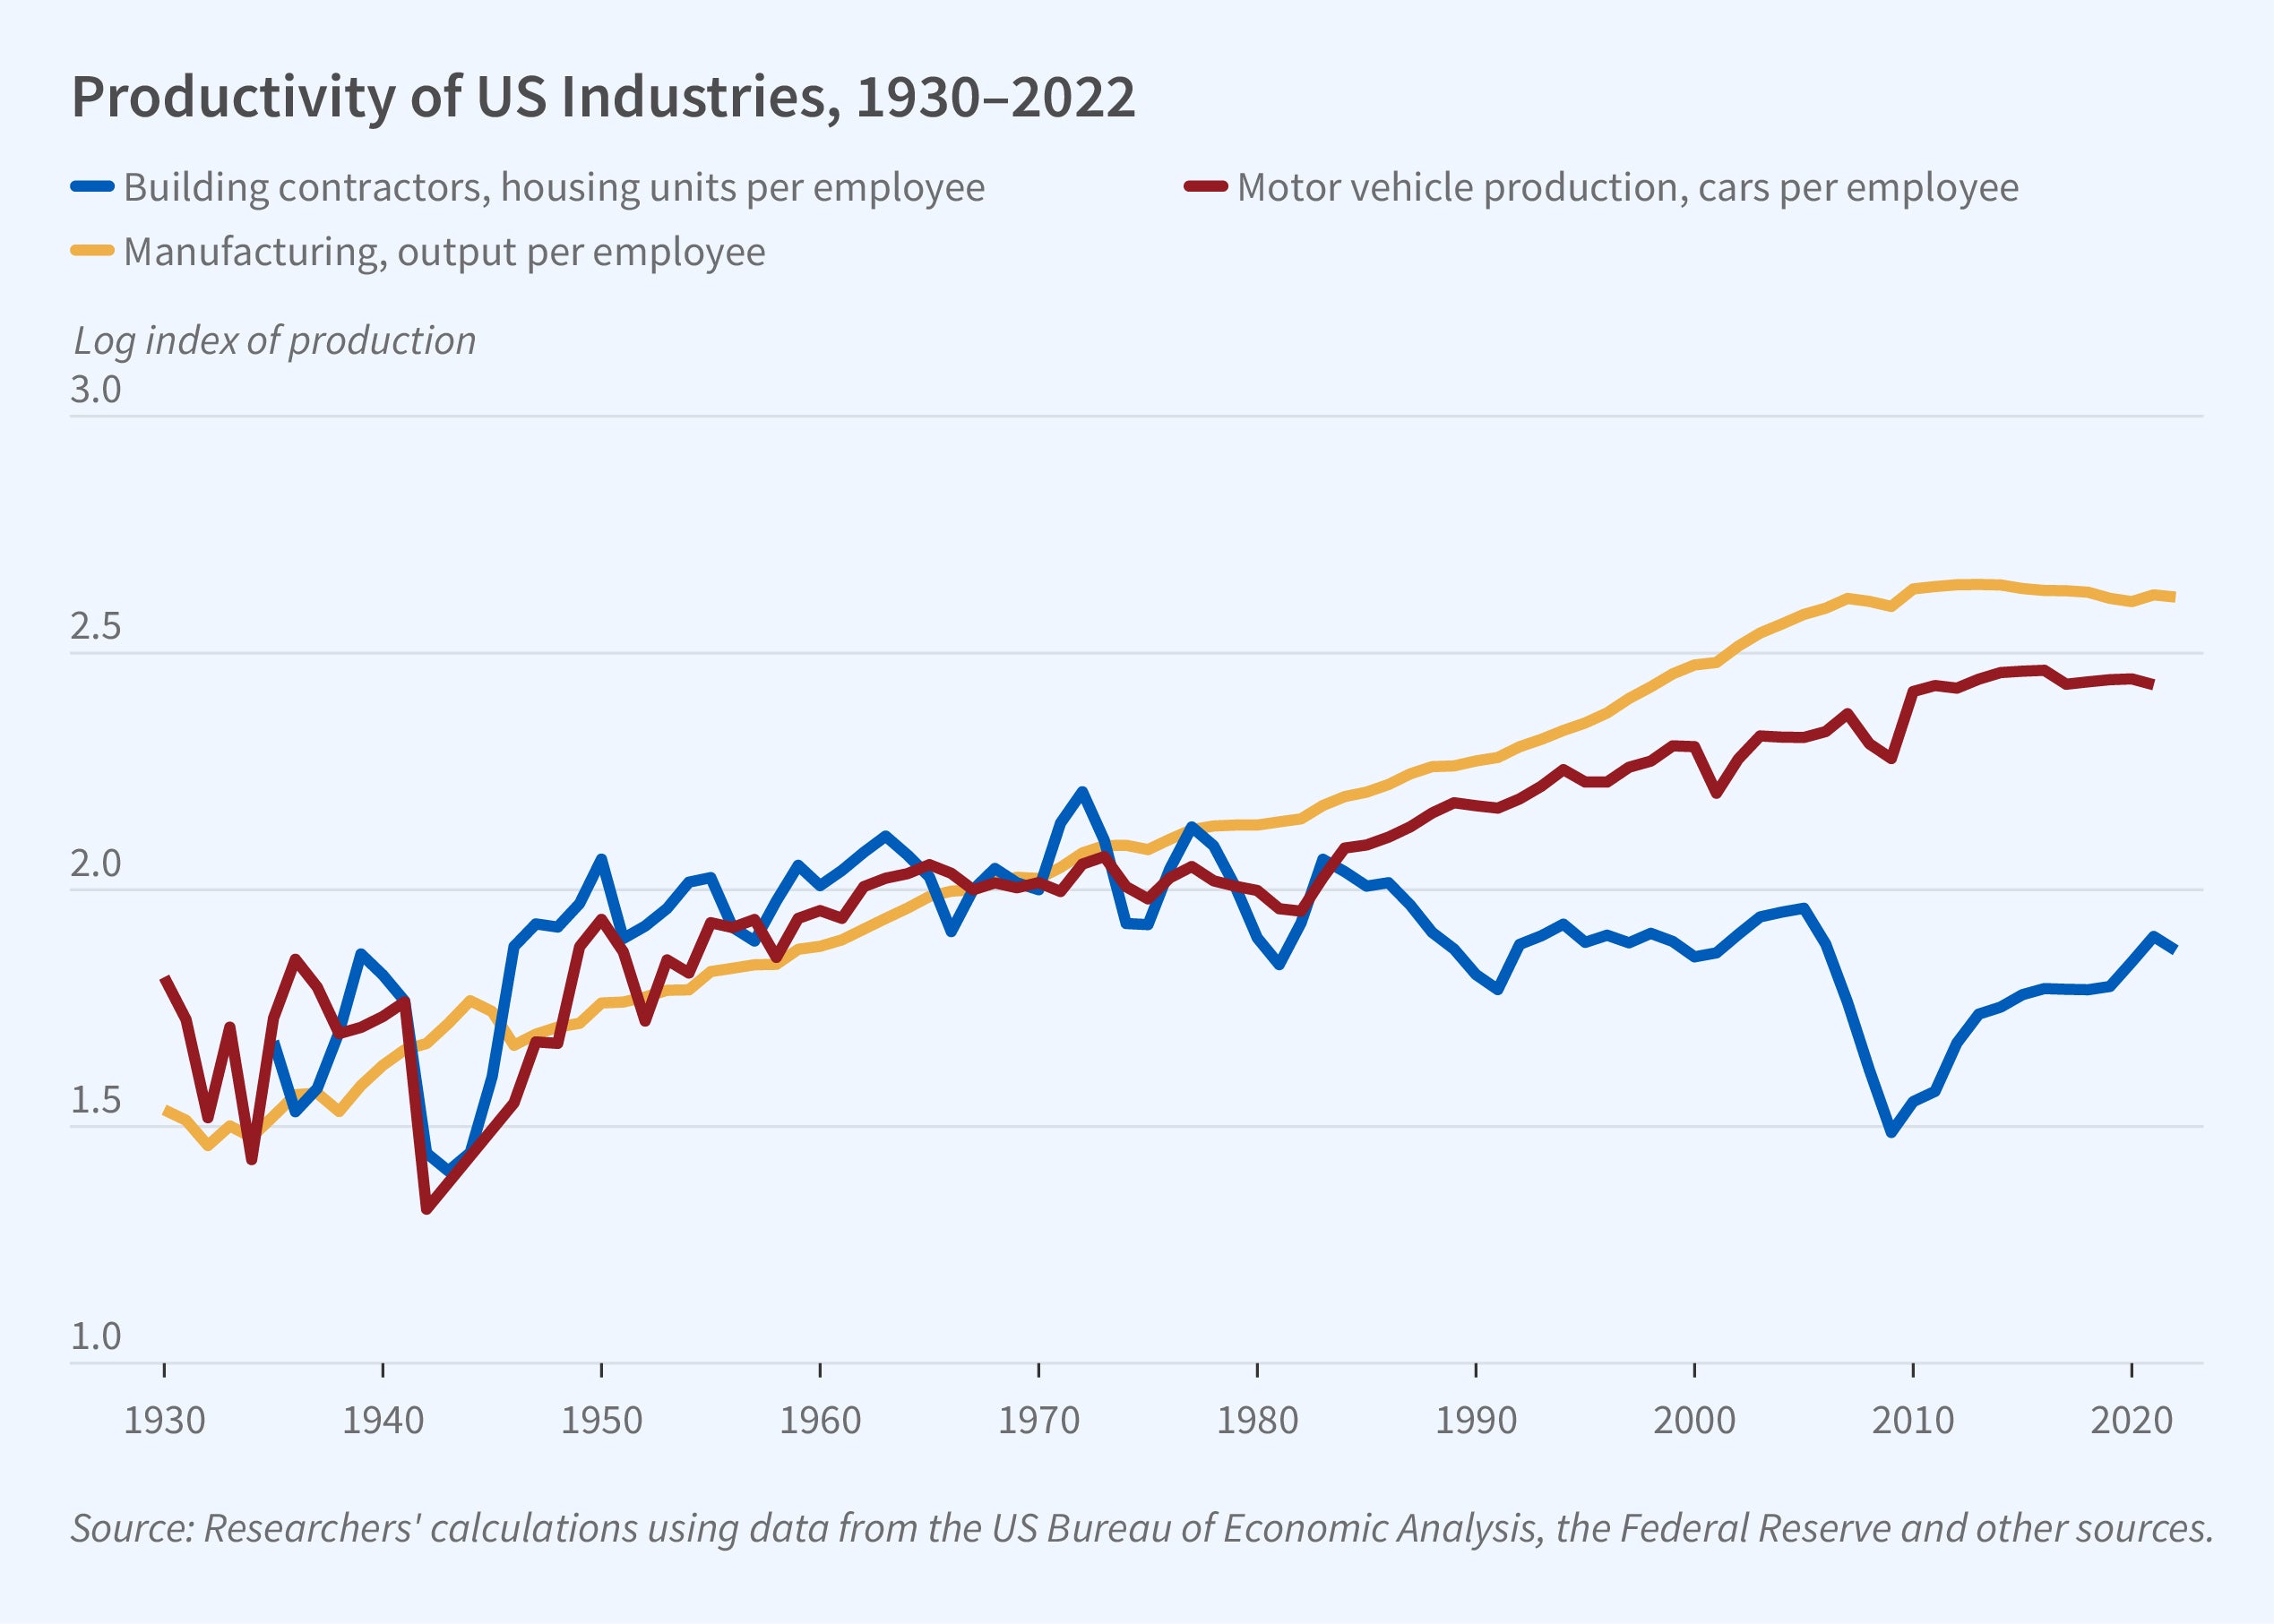
Local land use and state and federal environmental regulations proliferated in the early 1970s. About this time, US residential construction productivity began to decline; today, it is close to the level of the 1930s. In contrast, manufacturing productivity has risen for many decades. In the auto industry, for example, it has risen from 4.8 cars per employee per year in 1939 to around 25 per employee per year by 2020.
In Why Has Construction Productivity Stagnated? The Role of Land-Use Regulation (NBER Working Paper 33188), Leonardo D’Amico, Edward L. Glaeser, Joseph Gyourko, William R. Kerr, and Giacomo A. M. Ponzetto investigate the relationship between restrictive land use regulations and the residential construction productivity decline. They find that more restrictive regulation favors smaller projects, artificially limiting the size of the firms that build homes. Smaller firms invest less in technology. A back-of-the-envelope calculation shows that if half of the link between productivity and firm size is causal, homebuilding would be approximately 60 percent more productive if the size distribution of US homebuilding firms matched that of firms in the manufacturing sector.
Land use regulations are a key explanation for stagnant productivity in the residential construction sector.
Developers in the US generally partner with landowners and agree on a building project. They then propose that project to the various governmental authorities overseeing compliance with land use regulations. If all regulators approve, houses are built and sold by the developer. As regulatory burdens grow, approved projects tend to become smaller and their profitability declines. Building houses in highly regulated areas is unattractive to developers, and with fewer developers building, house prices rise. Smaller developers also have fewer incentives to invest in technology, further exacerbating the effect on prices. As area affordability declines, some residents leave.
The researchers estimate the relationship between productivity and firm size using the Census of Construction Industries (part of the Economic Census) and microdata from the Census Bureau’s Longitudinal Business Database. Both revenues and units built per employee increase as firm size increases. Firms with 20 to 99 employees produce 45 percent more units per employee than the smallest firms. Firms with more than 500 employees produce more than four times as many units per employee.
The researchers also use CoreLogic microdata for 167 counties covering 51 percent of the US population from 1950 to 2018 to measure the scale of development projects. They find that in 1950–51, 37 percent of homes built were in the largest 1 percent of development projects. By 2018–19, the comparable statistic was only 24 percent. They show that this decline in big projects is hardly explained by increased love of variety by consumers, and rather seems driven by supply. Controlling for house age, lot size, square footage, census tract, and year of sale, the homes from relatively large projects did not appreciate differentially over time.
To explore the relationship between regulation and home building firm size, the researchers use data from the Wharton Residential Land Use Regulatory Index. They find that Census Bureau core-based statistical areas with stricter land use regulations have smaller and less productive construction firms, and less residential and nonresidential construction activity.
Data on patent activity for the construction industry also suggest that as construction firms and projects become smaller, innovation declines. Patenting in construction and in sectors that mostly supply inputs to builders lagged the rest of the economy, especially since the 1970s.
— Linda Gorman
The researchers are grateful for the generous support of the Harvard Joint Center for Housing Studies, the Research Sponsor Program of the Zell/Lurie Real Estate Center at Wharton, and the Spanish Ministry of Economy and Competitiveness through its Severo Ochoa Program for Centers of Excellence in research and development (CEX2019-000915-S).


