Household Heat Pump Adoption and Energy Use
In Decarbonizing Heat: The Impact of Heat Pumps and a Time-of-Use Heat Pump Tariff on Energy Demand (NBER Working Paper 33036), researchers Louise Bernard, Andy Hackett, Robert D. Metcalfe, and Andrew Schein study the impact of heat pumps, a low-carbon alternative to gas boilers, on household energy demand. They analyze data from Octopus Energy, a global energy supplier, focusing specifically on residential heat pump installations in the UK. Their data sample includes the universe of Octopus heat pump adopters between early 2022 and mid-2024. There are 1,321 heat pump adopters in the sample and the average heat pump size is 8 kW. Almost all of these customers took advantage of the UK’s boiler upgrade scheme, a government subsidy that helps cover the cost of replacing fossil fuel heating systems with low-carbon technologies like heat pumps.
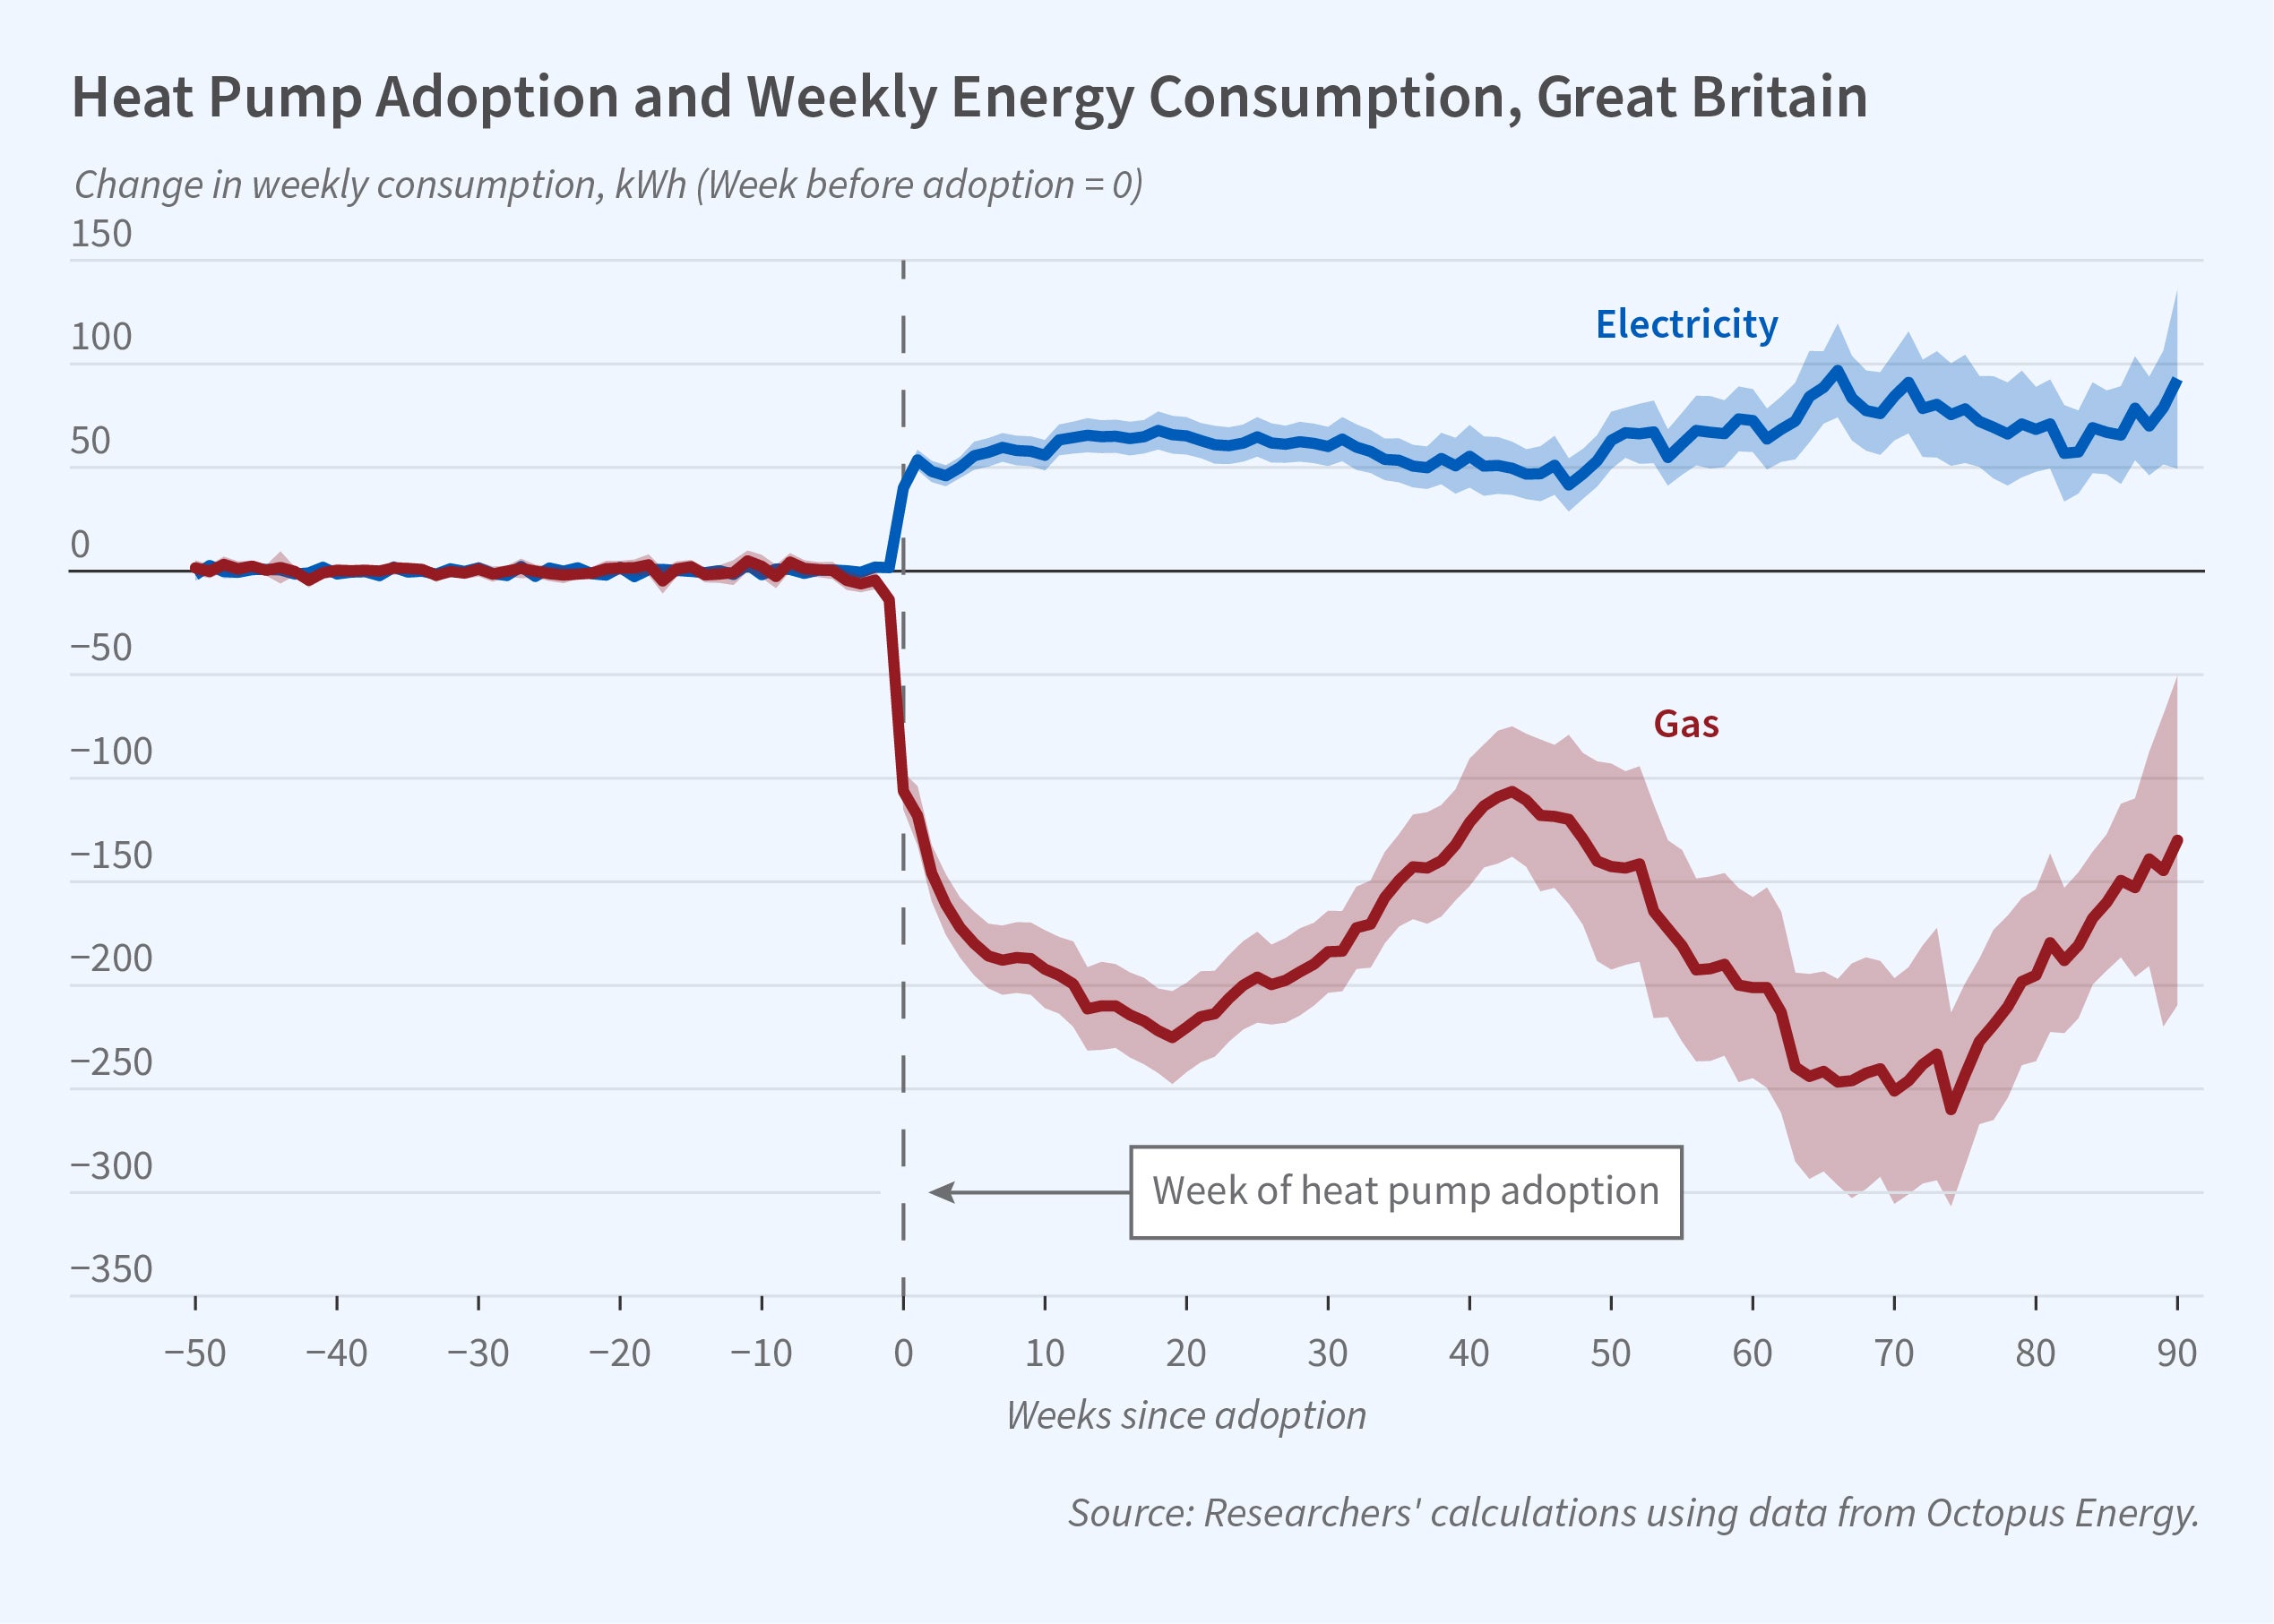
Consumers who replaced their gas boilers with heat pumps reduced their overall energy use by an average of 40 percent.
The researchers leverage the staggered rollout of heat pump installations to estimate the causal effect of boiler-to-heat pump incentive programs on consumers’ energy demand. Adoption of heat pumps alters the composition of energy demand: demand for gas drops by 90 percent and demand for electricity rises by 61 percent per year. Overall demand for energy declines by 40 percent. The net effect of these changes is a nearly 70 percent decline in households’ CO2 equivalent emissions throughout a heat pump’s operational lifespan.
The study also presents favorable evidence for the efficacy of time-of-use tariffs in reducing electricity consumption during periods of peak demand, when energy production is least carbon efficient. Octopus Energy’s time-of-use tariff involves a 40 percent marginal price reduction during periods when a higher share of electricity being supplied to the grid is from renewable energy sources. It also includes a 60 percent increase in marginal prices during peak use periods (4:00 pm–7:00 pm). Analyzing a sample of 6,631 Octopus Energy users who adopted the tariff between late 2022 and mid-2024, the researchers estimate that these consumers reduced energy consumption by one-half during the period of peak consumption and doubled consumption during the windows of time in which energy use was subsidized. In sum, consumers saved £318 by switching to the time-of-use tariff, and £240 of these savings were due to shifting demand away from peak periods.
The researchers estimate that for every £1 of net government expenditure, the UK boiler upgrade scheme generates £1.24 in social benefits. When they include possible learning-by-doing benefits from technological advances associated with greater heat pump use, the social benefit rises to £1.90. The welfare-enhancing properties of the subsidy are generated by the decarbonizing nature of this heat source and the reduction of air pollution associated with gas consumption.
— Laurel Britt


